

Question: In python please 1a) Create a function that takes the data frame as input and calculates a statistics of the overall deviation between expected and
In python please
1a)
Create a function that takes the data frame as input and calculates a statistics of the overall deviation between expected and observed frequencies: 2=()2/)2=()2/)
Where is the observed frequency for cell , is the expected frequency for cell , assuming independence of gender and genre. The sum is to be taken over all 10 cells. This test-statistic is called the Chi-square test of independence.
The function should take a data frame and return the Chi-square value. Make sure that the function performs all the required computations - it should work without you having to run the code from Question #2 first.
Report the value of this statistic for the real data.
Extra challenge: Make your code more flexible by not always using genre and dirGender to make the crosstab, but by providing the name of the row and column variable as an input (not required for full points).
b) Write a randomization function, so it it becomes more versatile by adding additional input arguments that determines the behavior of the routine.
- The first argument should still be a dataframe (as before)
- The second input argument should be a function that computes the test statistics. All test-statistic functions are assumed to take the data frame as the first and only input.
- The third input argument is the name of the dataframe column that is being shuffled.
- An optional input argument: the number of iterations (default=500)
- An optional input argument: the number of sides of the test (1 or 2; default = 1). If the test is two-sided, then count the number of cases where the absolute value of the test statistic (np.abolute) is larger or equal to the real test statistic.
- An optional input argument: The number of bins for plotting the histogram
c) Perform a randomization test for the Chi-square test of independence. Your function should plot the histogram and report the p-value.
All data is being pulled from a file called movie.csv, below is a screenshot of the head()
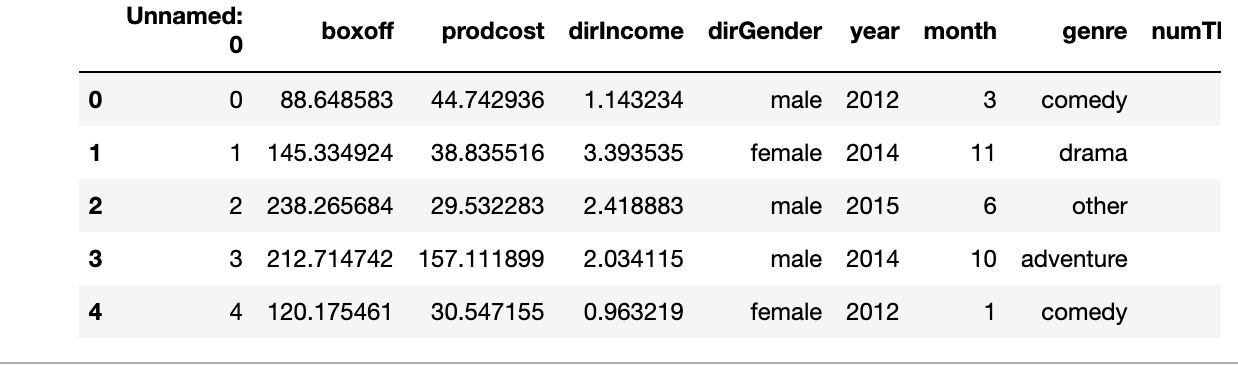
Unnamed: \begin{tabular}{rrrrrrrrr} & Unnamed: & boxoff & prodcost & dirlncome & dirGender & year & month & genre numTI \\ \hline 0 & 0 & 88.648583 & 44.742936 & 1.143234 & male 2012 & 3 & comedy \\ 1 & 1 & 145.334924 & 38.835516 & 3.393535 & female 2014 & 11 & drama \\ 2 & 2 & 238.265684 & 29.532283 & 2.418883 & male 2015 & 6 & other \\ 3 & 3 & 212.714742 & 157.111899 & 2.034115 & male 2014 & 10 & adventure \\ 4 & 4 & 120.175461 & 30.547155 & 0.963219 & female 2012 & 1 & comedy \end{tabular}
Step by Step Solution
There are 3 Steps involved in it

Get step-by-step solutions from verified subject matter experts