

Question: In PYTHON please Ive attached example code from car _ info.csv A CSV file ( car _ info.csv ) has been provided which contains information
In PYTHON please Ive attached example code from carinfo.csv
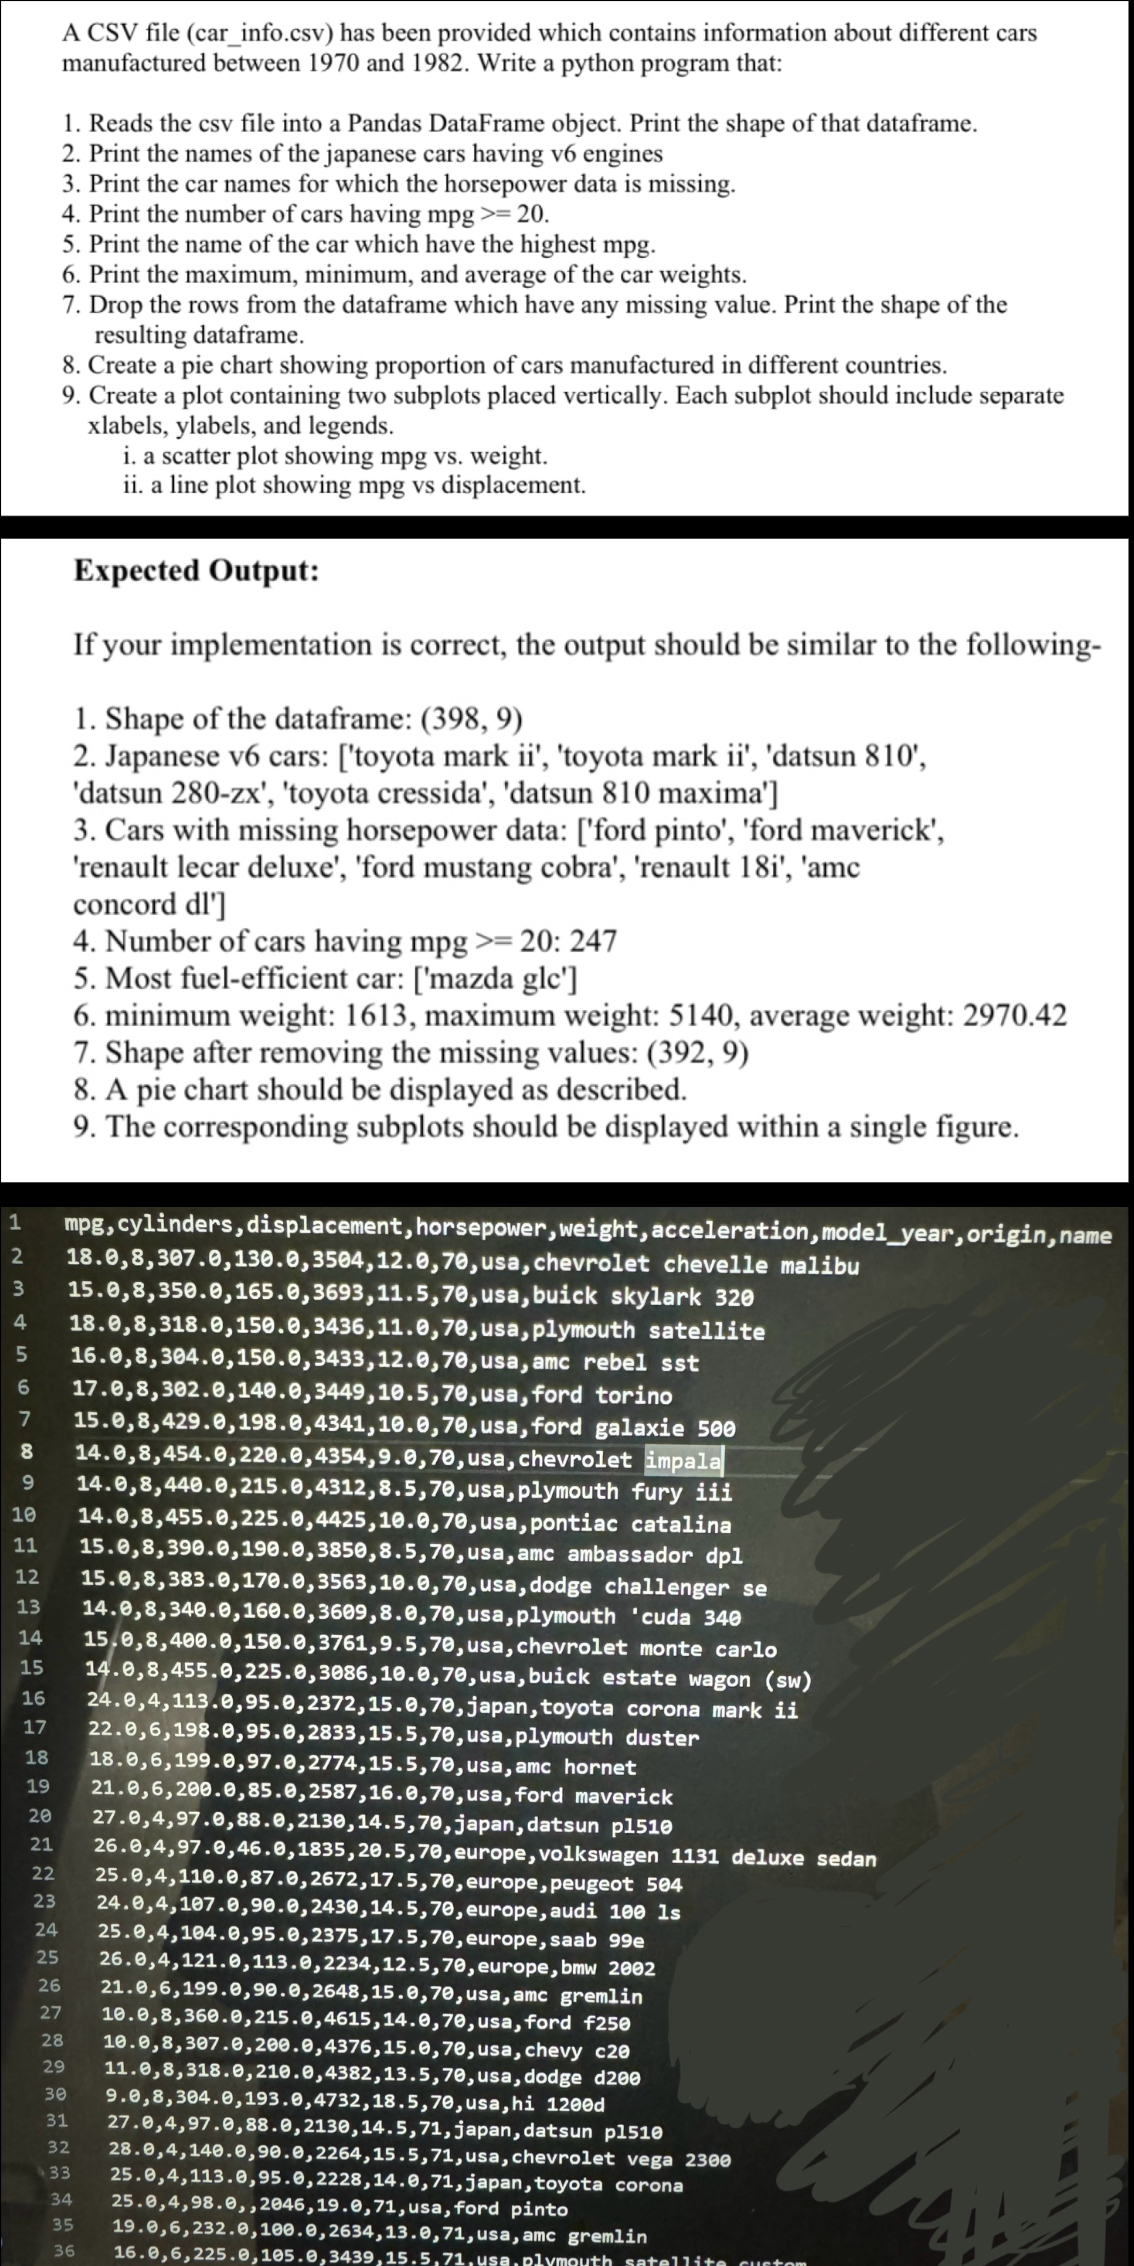
A CSV file carinfo.csv has been provided which contains information about different cars manufactured between and Write a python program that:
Reads the csv file into a Pandas DataFrame object. Print the shape of that dataframe.
Print the names of the japanese cars having v engines
Print the car names for which the horsepower data is missing.
Print the number of cars having
Print the name of the car which have the highest mpg
Print the maximum, minimum, and average of the car weights.
Drop the rows from the dataframe which have any missing value. Print the shape of the resulting dataframe.
Create a pie chart showing proportion of cars manufactured in different countries.
Create a plot containing two subplots placed vertically. Each subplot should include separate xlabels, ylabels, and legends.
i a scatter plot showing mpg vs weight.
ii a line plot showing mpg vs displacement.
Expected Output:
If your implementation is correct, the output should be similar to the following
Shape of the dataframe:
Japanese v cars: toyota mark ii 'toyota mark ii 'datsun 'datsun zx 'toyota cressida', 'datsun maxima'
Cars with missing horsepower data: ford pinto', 'ford maverick', 'renault lecar deluxe', 'ford mustang cobra', 'renault i 'amc concord dl
Number of cars having mpg :
Most fuelefficient car: mazda glc
minimum weight: maximum weight: average weight:
Shape after removing the missing values:
A pie chart should be displayed as described.
The corresponding subplots should be displayed within a single figure.
Step by Step Solution
There are 3 Steps involved in it
1 Expert Approved Answer
Step: 1 Unlock

Question Has Been Solved by an Expert!
Get step-by-step solutions from verified subject matter experts
Step: 2 Unlock
Step: 3 Unlock