

Question: in python. Plot a similar chart to show the average bicycle counts for all three columns Total, East and West for day of the week.
 in python. Plot a similar chart to show the average bicycle counts for all three columns Total, East and West for day of the week. But instead of leaving the index as 0 (Mon), 1, 2, ,3, 4, 5, 6 (Sun), set it to Mon, Tue, Wed, Thu, Fri, Sat, Sun.
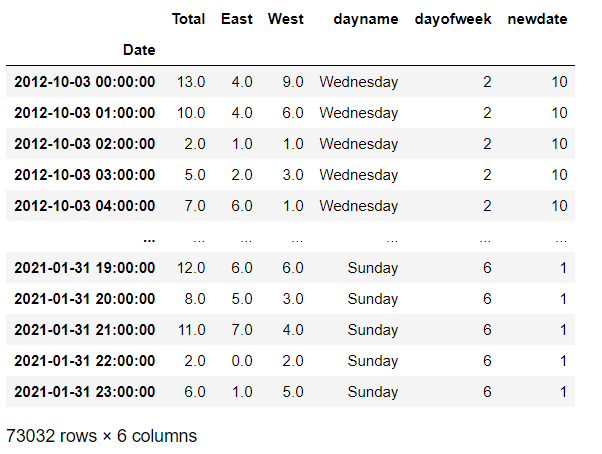
Total East West dayname dayofweek newdate Date 13.0 4.0 2 10 2012-10-03 00:00:00 2012-10-03 01:00:00 10.0 4.0 2 10 2012-10-03 02:00:00 2.0 1.0 9.0 Wednesday 6.0 Wednesday 1.0 Wednesday 3.0 Wednesday 1.0 Wednesday 2 10 2012-10-03 03:00:00 5.0 2.0 2 10 2012-10-03 04:00:00 7.0 6.0 2. 10 .. 2021-01-31 19:00:00 12.0 6.0 6.0 Sunday 6 1 2021-01-31 20:00:00 8.0 5.0 3.0 6 1 2021-01-31 21:00:00 11.0 7.0 4.0 Sunday Sunday Sunday 6 1 2021-01-31 22:00:00 2.0 0.0 2.0 6 1 2021-01-31 23:00:00 6.0 1.0 5.0 Sunday 6 1 73032 rows x 6 columns
Step by Step Solution
There are 3 Steps involved in it

Get step-by-step solutions from verified subject matter experts