

Question: In Python using Matplotlib : Create a graph of the squares of the odd numbers between 1 and 100 displayed with a .2 interval. It
In Python using Matplotlib :
Create a graph of the squares of the odd numbers between 1 and 100 displayed with a .2 interval. It should look like this example:
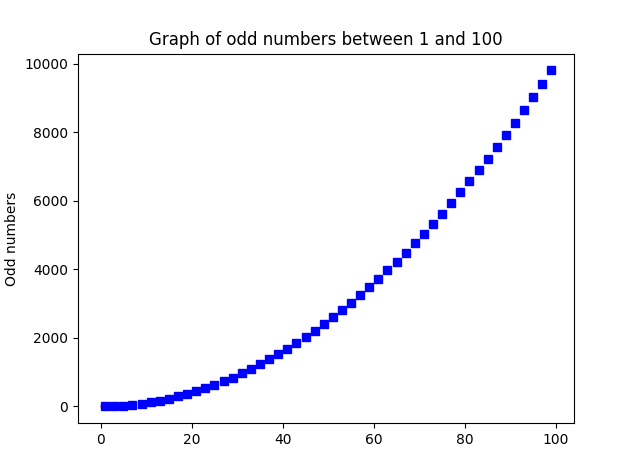
Graph of odd numbers between 1 and 100 10000 8000 6000 4000 2000 0 0 20 40 60 80 100
Step by Step Solution
There are 3 Steps involved in it
1 Expert Approved Answer
Step: 1 Unlock

Question Has Been Solved by an Expert!
Get step-by-step solutions from verified subject matter experts
Step: 2 Unlock
Step: 3 Unlock