

Question: In Python using Pandas and numpy if you have to but preferably only pandas. Below is the question guide given: TABLE 3: Quantile Analysis of
In Python using Pandas and numpy if you have to but preferably only pandas.
Below is the question guide given:
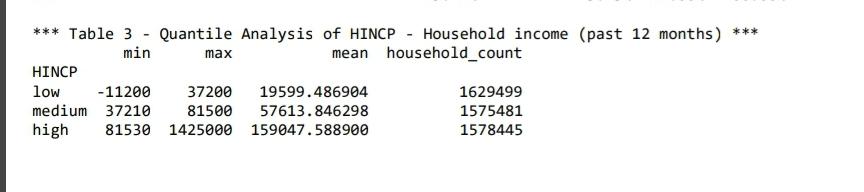
TABLE 3: Quantile Analysis of HINCP - Household income (past 12 months) Rows should correspond to different quantiles of HINCP: low (0-1/3), medium (1/3-2/3), high (2/3-1) Columns displayed should be: min, max, mean, household_count The household_count column contains entries with the sum of WGTP values for the corresponding range of HINCP values (low, medium, or high)
Below is the desired output:
Let me know if you need more info
Additional Info:
My data is in csv. I need to grab the HINCP and WGTP columns.
Data is floats, sample size of data:
| HINCP | WGTP |
|---|---|
| 4200 | 12 |
| 9400 | 65 |
| Null | 171 |
| 81000 | 56 |
You need to have the rows represent the given quantile asked for HINCP data using pandas. The columns are min max and mean along with Household count which is the sum of WGTP values for corresponding values of HINCP at that given quantile.
*** Table 3 - Quantile Analysis of HINCP - Household income (past 12 months) **
Step by Step Solution
There are 3 Steps involved in it

Get step-by-step solutions from verified subject matter experts