

Question: In Python , we are using the following file to generate a scatterplot given the text file below. Shown below is my python code, which
In Python, we are using the following file to generate a scatterplot given the text file below.
 Shown below is my python code, which works as it is to generate one scatterplot with sepal length as x-axis and petal width as y-axis.
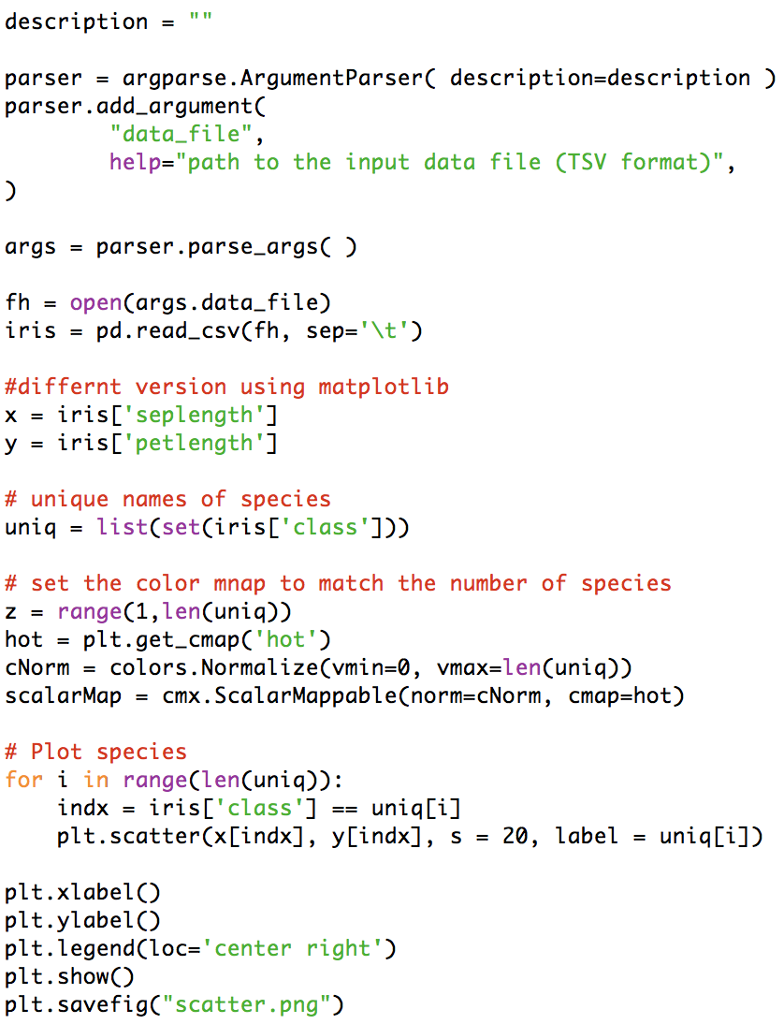
However, my code must incorporate a command-line interface (using the argparse module) with the following:
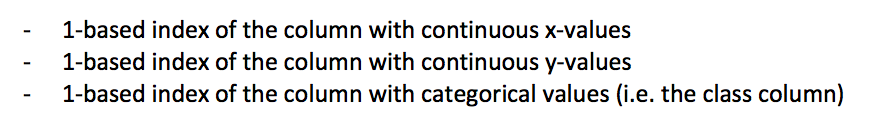 In other words, I should be able to use any of the four continuous width/length columns as either my x or y value using the argparse function. I should also be able to specify the include of categorical value (the class column) specified by the argparse function.
Please tell me how I can implement a command-line interface in my code.
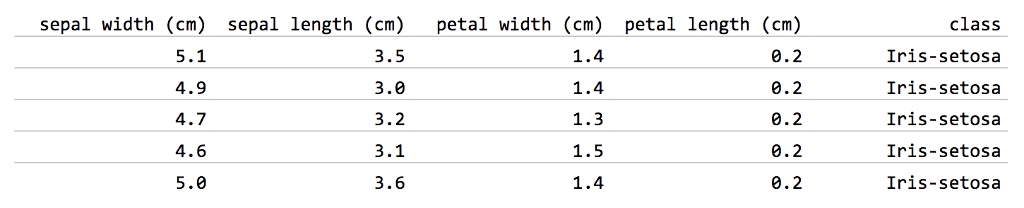
sepal width (cm) sepal length (cm) petal width (cm) petal length (cm) 0.2 0.2 0.2 0.2 .2 3.5 3.0 3.2 3.1 3.6 class Iris-setosa Iris-setosa Iris-setosa Iris-setosa Iris-setosa 1.4 4.9 4.7 4.6 5.0 1.4 1.5 1.4 sepal width (cm) sepal length (cm) petal width (cm) petal length (cm) 0.2 0.2 0.2 0.2 .2 3.5 3.0 3.2 3.1 3.6 class Iris-setosa Iris-setosa Iris-setosa Iris-setosa Iris-setosa 1.4 4.9 4.7 4.6 5.0 1.4 1.5 1.4
Step by Step Solution
There are 3 Steps involved in it

Get step-by-step solutions from verified subject matter experts