

Question: In R programming, make the y labels show up as 60s, 40s, 20s. Make this appear with and without ggplot Returns: Tracked and Untracked Customers
In R programming, make the y labels show up as 60s, 40s, 20s. Make this appear with and without ggplot
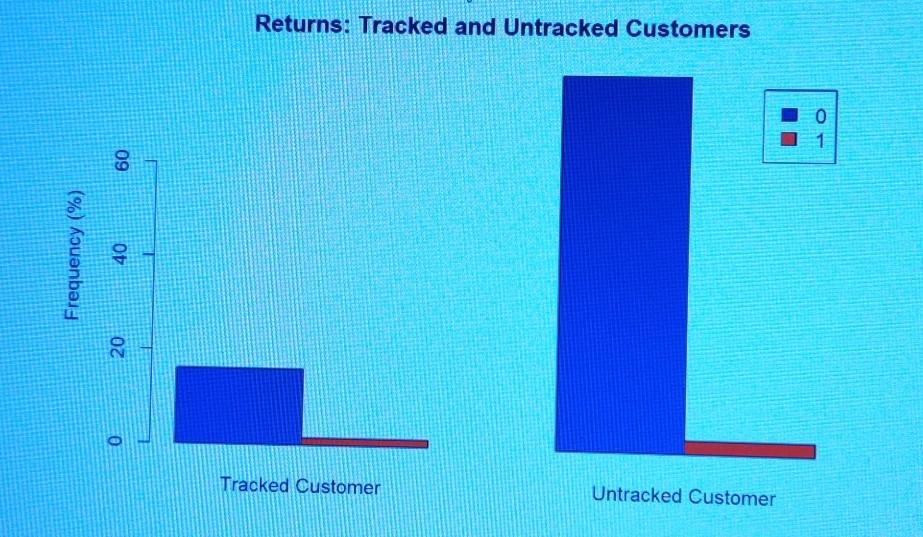
Returns: Tracked and Untracked Customers 0 1 1 60 Frequency (%) 40 20 o Tracked Customer Untracked Customer
Step by Step Solution
There are 3 Steps involved in it
1 Expert Approved Answer
Step: 1 Unlock

Question Has Been Solved by an Expert!
Get step-by-step solutions from verified subject matter experts
Step: 2 Unlock
Step: 3 Unlock