

Question: In SageMath, vector fields can be easily plotted with the plot_vector_field command. For example, the vector field in Figure 1.39 on the previous page was
In SageMath, vector fields can be easily plotted with the plot_vector_field command. For example, the vector field in Figure 1.39 on the previous page was plotted with the command
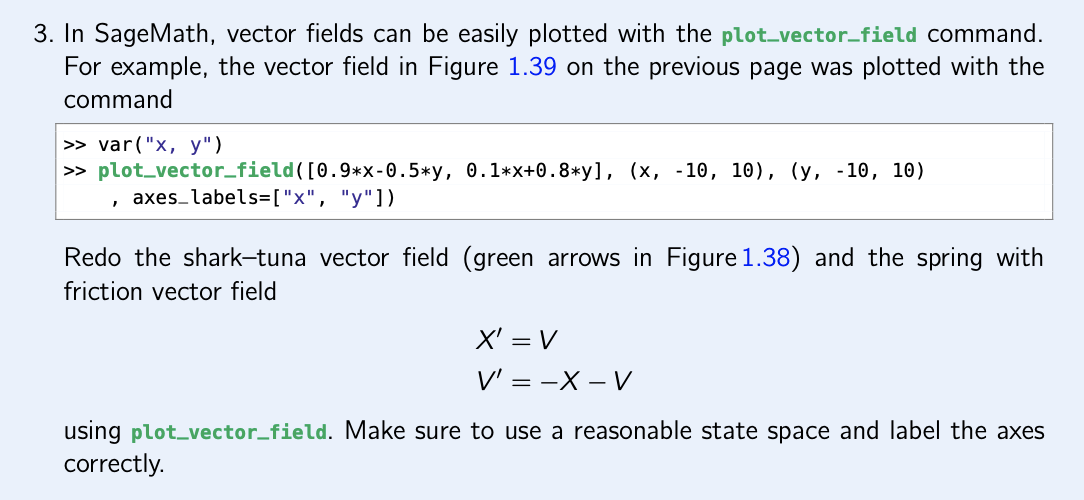 3. In SageMath, vector fields can be easily plotted with the plot_vector_field command. For example. the vector field in Figure 1.39 on the previous page was plotted with the command
 Step by Step Solution
There are 3 Steps involved in it
1 Expert Approved Answer
Step: 1 Unlock

Question Has Been Solved by an Expert!
Get step-by-step solutions from verified subject matter experts
Step: 2 Unlock
Step: 3 Unlock