

Question: In statistics assignment students examined the relationship between weekly time spent studying (x) statistics subject and marks obtained (y) in it. They ran simple linear
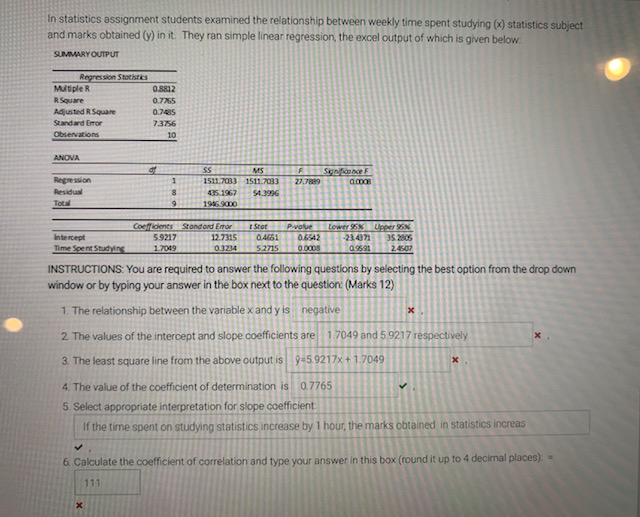
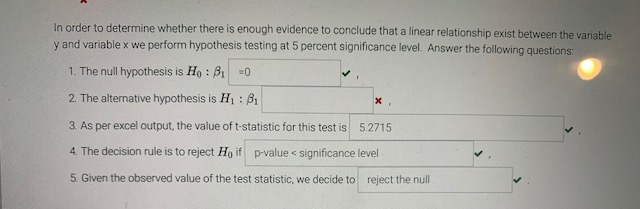
In statistics assignment students examined the relationship between weekly time spent studying (x) statistics subject and marks obtained (y) in it. They ran simple linear regression, the excel output of which is given below. SUMMARY OUTPUT Regression S tothers Multiple R 0.8912 R Square 0.715 Adjusted R Squire 0.7485 Standard Error 7.3756 10 AMOVA SS MS 1511 7013 1511 7013 435 1967 1916 4000 Coefficients Standard Emor i Spot Fewer Pik | Upper SON Intercept 59217 12 7315 0.4651 06512 -214371 35 2805 Time Spent Studying 1 7019 5.2715 24607 INSTRUCTIONS: You are required to answer the following questions by selecting the best option from the drop down window or by typing your answer in the box next to the question: (Marks 12) 1. The relationship between the variable x and y is negative 2. The values of the intercept and slope coefficients are | 1.7049 and 5.9217 respectively 3. The least square line from the above output is 9=5.9217x + 1.7049 4. The value of the coefficient of determination is 0.7765 5. Select appropriate interpretation for slope coefficient: If the time spent on studying statistics increase by 1 hour, the marks obtained in statistics increas 6. Calculate the coefficient of correlation and type your answer in this box (round it up to 4 decimal places): a 111In order to determine whether there is enough evidence to conclude that a linear relationship exist between the variable y and variable x we perform hypothesis testing at 5 percent significance level. Answer the following questions: 1. The null hypothesis is Ho : 1 =0 2. The alternative hypothesis is H1 : 8, 3. As per excel output, the value of t-statistic for this test is 5.2715 4. The decision rule is to reject Ho if p-value
Step by Step Solution
There are 3 Steps involved in it

Get step-by-step solutions from verified subject matter experts