

Question: In statistics, it is known that the average is sensitive to outliers, With the following data of 10 values; data = c(4.81, 4.17, 4.41, 3.59,
In statistics, it is known that the average is sensitive to outliers,
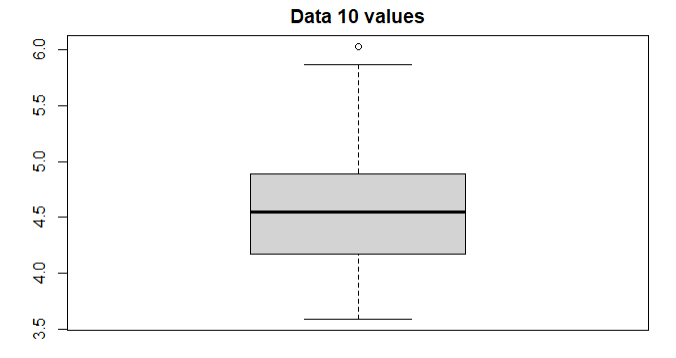
With the following data of 10 values;
data = c(4.81, 4.17, 4.41, 3.59, 5.87, 3.83, 6.03, 4.89, 4.32, 4.69)
type the following expression in R boxplot(data)$out; and throws the following


Step by Step Solution
There are 3 Steps involved in it
1 Expert Approved Answer
Step: 1 Unlock

Question Has Been Solved by an Expert!
Get step-by-step solutions from verified subject matter experts
Step: 2 Unlock
Step: 3 Unlock