

Question: In Table 10-9, the cumulative default probability over three years for CCC-rated corporate bonds is 33.75 percent. Check this calculation using the individual year MMRs.
In Table 10-9, the cumulative default probability over three years for CCC-rated corporate bonds is 33.75 percent. Check this calculation using the individual year MMRs.
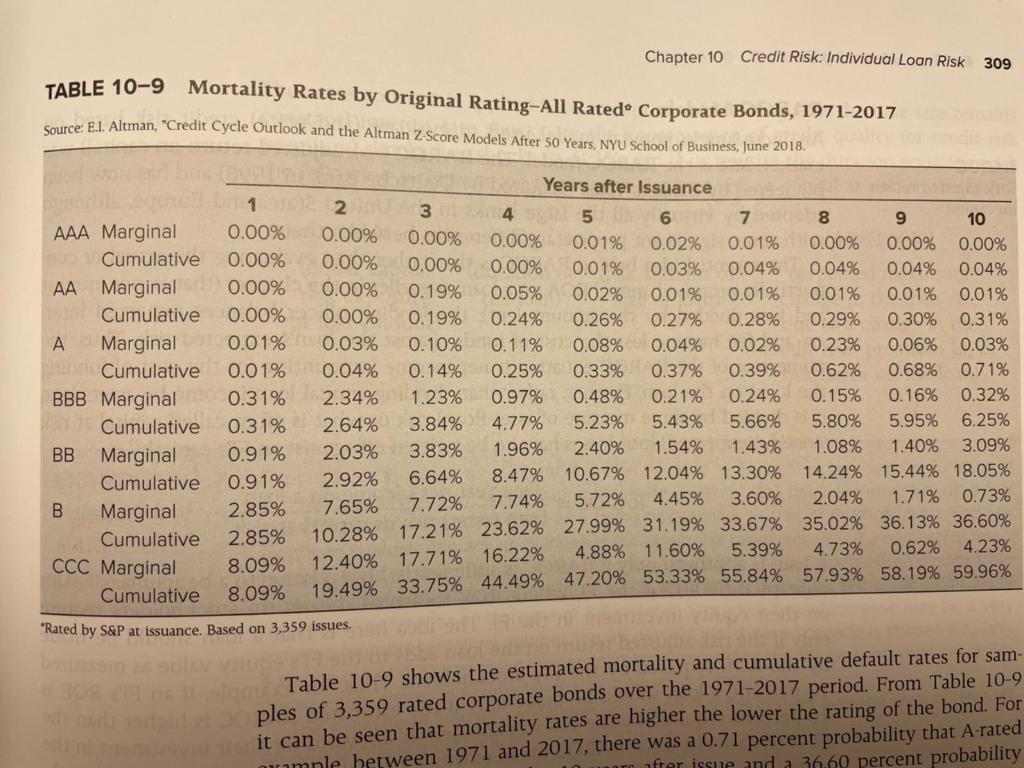
Chapter 10 Credit Risk: Individual Loan Risk 309 TABLE 10-9 Mortality Rates by Original Rating-All Rated Corporate Bonds, 1971-2017 Source: E.1. Altman, "Credit Cycle Outlook and the Altman Z-Score Models After 50 Years, NYU School of Business, June 2018. Years after Issuance 1 E 2 3 4 5 N 7 8 9 10 AAA Marginal 0.00% 0.00% 0.00% 0.00% 0.01% 0.02% 0.01% 0.00% 0.00% 0.00% Cumulative 0.00% 0.00% 0.00% 0.00% 0.01% 0.03% 0.04% 0.04% 0.04% 0.04% AA Marginal 0.00% 0.00% 0.19% 0.05% 0.02% 0.01% 0.01% 0.01% 0.01% 0.01% Cumulative 0.00% 0.00% 0.19% 0.24% 0.26% 0.27% 0.28% 0.29% 0.30% 0.31% A Marginal 0.01% 0.03% 0.10% 0.11% 0.08% 0.04% 0.02% 0.23% 0.06% 0.03% Cumulative 0.01% 0.04% 0.14% 0.25% 0.33% 0.37% 0.39% 0.62% 0.68% 0.71% BBB Marginal 0.31% 2.34% 1.23% 0.97% 0.48% 0.21% 0.24% 0.15% 0.16% 0.32% Cumulative 0.31% 2.64% 3.84% 4.77% 5.23% 5.43% 5.66% 5.80% 5.95% 6.25% BB 0.91% Marginal 2.03% 3.83% 1.96% 2.40% 1.54% 1.43% 1.40% 3.09% 1.08% Cumulative 0.91% 2.92% 6.64% 8.47% 10.67% 12.04% 13.30% 14.24% 15.44% 18.05% 2.85% 7.65% 7.72% B 7.74% 5.72% 4.45% 3.60% 1.71% 0.73% Marginal 2.04% Cumulative 2.85% 10.28% 17.21% 23.62% 27.99% 31.19% 33.67% 35.02% 36.13% 36.60% 4.88% 11.60% 5.39% 4.73% 0.62% 4.23% CCC Marginal 8.09% 12.40% 17.71% 16.22% Cumulative 8.09% 19.49% 33.75% 44.49% 47.20% 53.33% 55.84% 57.93% 58.19% 59.96% "Rated by S&P at issuance. Based on 3,359 issues. Danas sul 33 HEO Table 10-9 shows the estimated mortality and cumulative default rates for sam- dariples of 3,359 rated corporate bonds over the 1971-2017 period. From Table 10-9 it can be seen that mortality rates are higher the lower the rating of the bond. For nmnle hetween 1971 and 2017, there was a 0.71 percent probability that A-rated ofrer issue and a 36.60 percent probability Chapter 10 Credit Risk: Individual Loan Risk 309 TABLE 10-9 Mortality Rates by Original Rating-All Rated Corporate Bonds, 1971-2017 Source: E.1. Altman, "Credit Cycle Outlook and the Altman Z-Score Models After 50 Years, NYU School of Business, June 2018. Years after Issuance 1 E 2 3 4 5 N 7 8 9 10 AAA Marginal 0.00% 0.00% 0.00% 0.00% 0.01% 0.02% 0.01% 0.00% 0.00% 0.00% Cumulative 0.00% 0.00% 0.00% 0.00% 0.01% 0.03% 0.04% 0.04% 0.04% 0.04% AA Marginal 0.00% 0.00% 0.19% 0.05% 0.02% 0.01% 0.01% 0.01% 0.01% 0.01% Cumulative 0.00% 0.00% 0.19% 0.24% 0.26% 0.27% 0.28% 0.29% 0.30% 0.31% A Marginal 0.01% 0.03% 0.10% 0.11% 0.08% 0.04% 0.02% 0.23% 0.06% 0.03% Cumulative 0.01% 0.04% 0.14% 0.25% 0.33% 0.37% 0.39% 0.62% 0.68% 0.71% BBB Marginal 0.31% 2.34% 1.23% 0.97% 0.48% 0.21% 0.24% 0.15% 0.16% 0.32% Cumulative 0.31% 2.64% 3.84% 4.77% 5.23% 5.43% 5.66% 5.80% 5.95% 6.25% BB 0.91% Marginal 2.03% 3.83% 1.96% 2.40% 1.54% 1.43% 1.40% 3.09% 1.08% Cumulative 0.91% 2.92% 6.64% 8.47% 10.67% 12.04% 13.30% 14.24% 15.44% 18.05% 2.85% 7.65% 7.72% B 7.74% 5.72% 4.45% 3.60% 1.71% 0.73% Marginal 2.04% Cumulative 2.85% 10.28% 17.21% 23.62% 27.99% 31.19% 33.67% 35.02% 36.13% 36.60% 4.88% 11.60% 5.39% 4.73% 0.62% 4.23% CCC Marginal 8.09% 12.40% 17.71% 16.22% Cumulative 8.09% 19.49% 33.75% 44.49% 47.20% 53.33% 55.84% 57.93% 58.19% 59.96% "Rated by S&P at issuance. Based on 3,359 issues. Danas sul 33 HEO Table 10-9 shows the estimated mortality and cumulative default rates for sam- dariples of 3,359 rated corporate bonds over the 1971-2017 period. From Table 10-9 it can be seen that mortality rates are higher the lower the rating of the bond. For nmnle hetween 1971 and 2017, there was a 0.71 percent probability that A-rated ofrer issue and a 36.60 percent probability
Step by Step Solution
There are 3 Steps involved in it

Get step-by-step solutions from verified subject matter experts