

Question: In testing the hypothesis H0 : = 0 versus Ha : 3 > 0, what is the t-statistic? O 2.850 O (0.5)(2.850) O 39.71 0
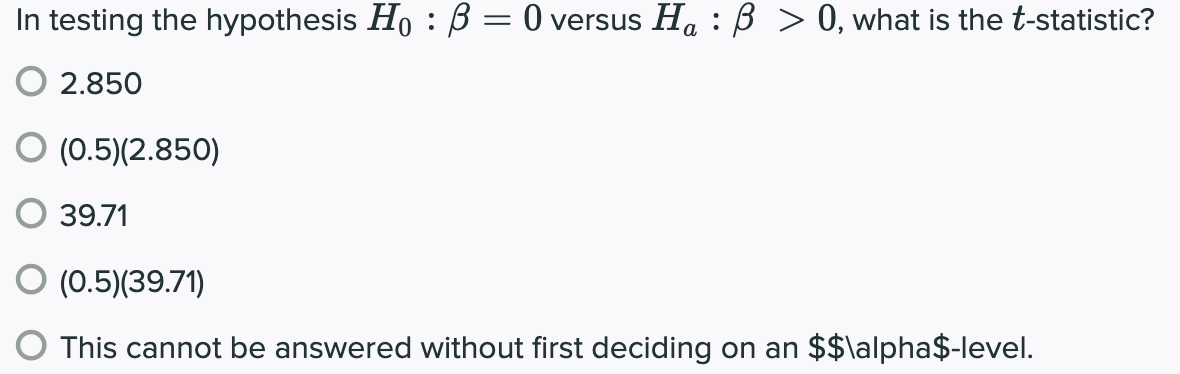
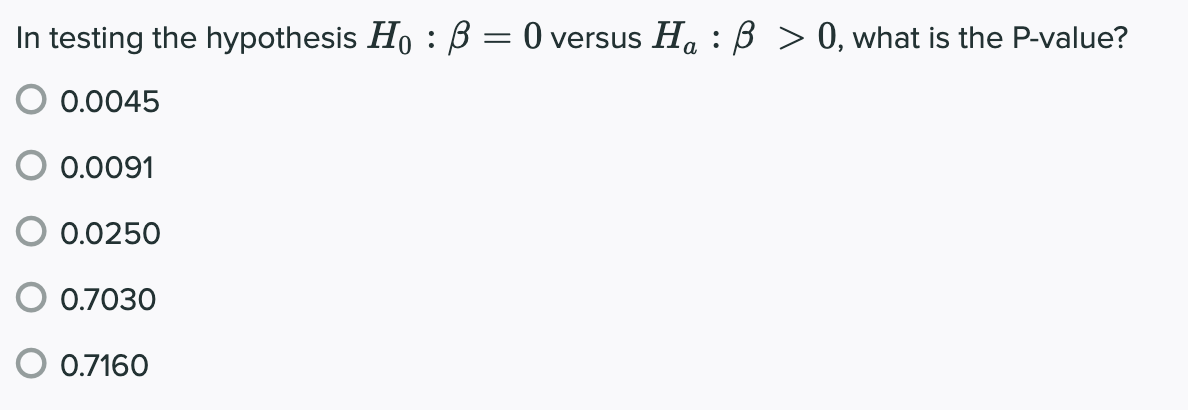
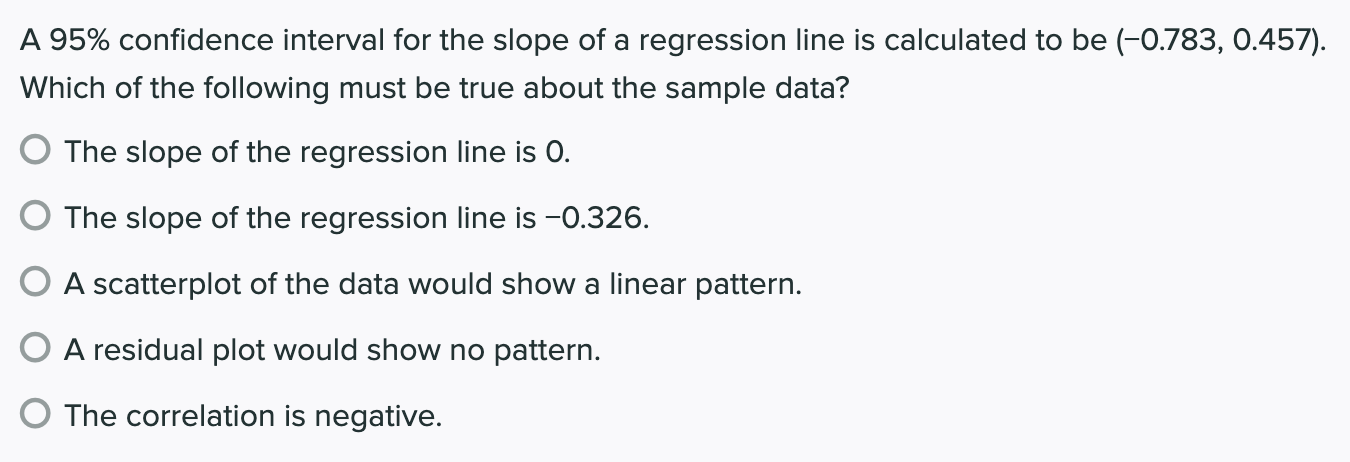
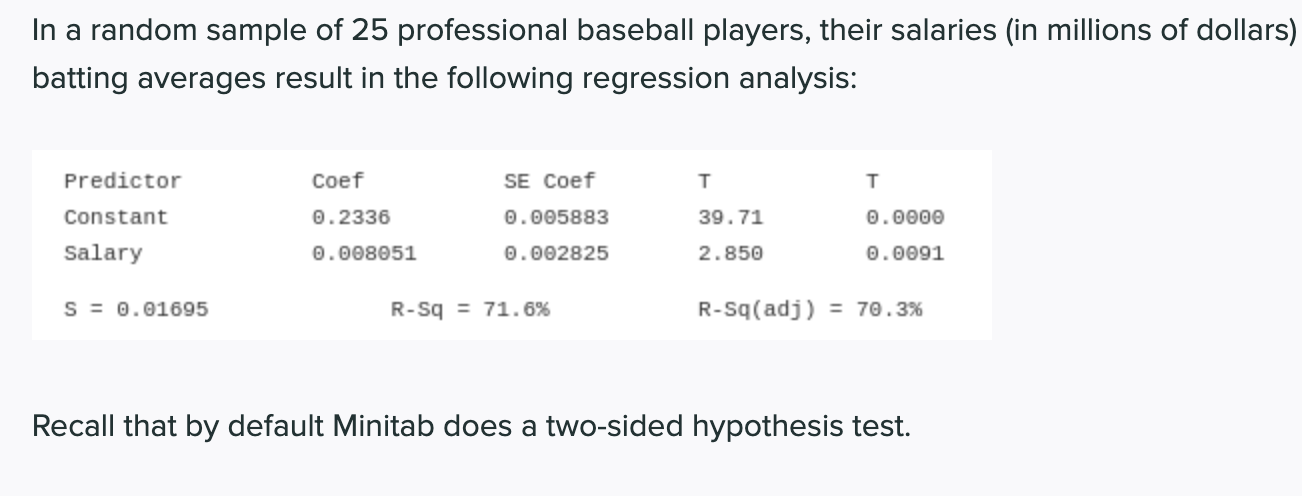
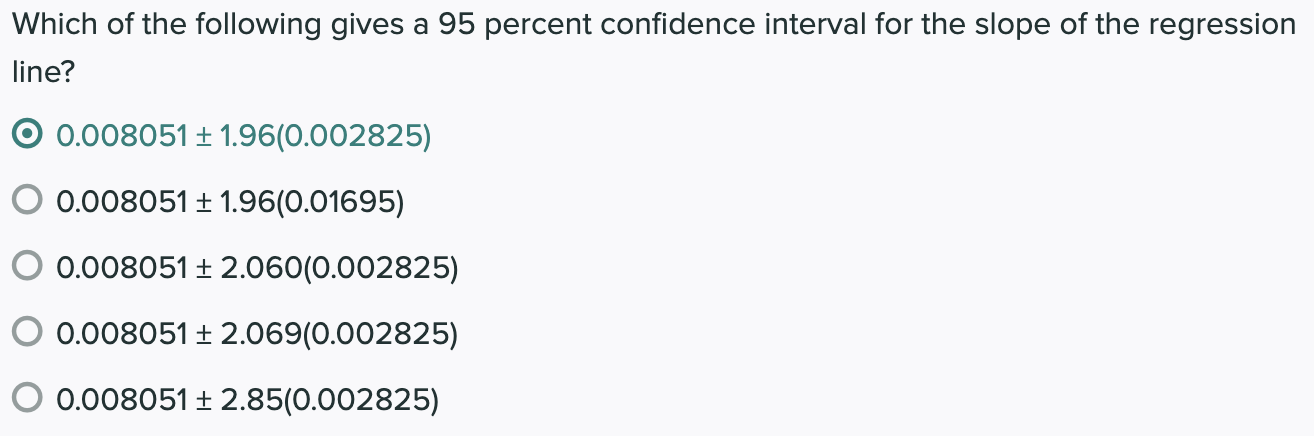
In testing the hypothesis H0 : = 0 versus Ha : 3 > 0, what is the t-statistic? O 2.850 O (0.5)(2.850) O 39.71 0 (0.5)(39.71) O This cannot be answered without first deciding on an $$\\alpha$-level. \fA 95% confidence interval for the slope of a regression line is calculated to be (-0.783, 0.457). Which of the following must be true about the sample data? C The slope of the regression line is 0. O The slope of the regression line is -0.326. O A scatterplot of the data would show a linear pattern. 0 A residual plot would show no pattern. 0 The correlation is negative. In a random sample of 25 professional baseball players, their salaries (in millions of dollars) batting averages result in the following regression analysis: Predictor Coef SE Coef T T Constant 0. 2336 0 . 005883 39. 71 0. 0909 Salary 0 . 008051 0 . 002825 2.850 0. 0091 S = 0. 01695 R-Sq = 71.6% R-Sq(adj ) = 70.3% Recall that by default Minitab does a two-sided hypothesis test.Which of the following gives a 95 percent confidence interval for the slope of the regression line? 0.008051 + 1.96(0.002825) O 0.008051 + 1.96(0.01695) O 0.008051 + 2.060(0.002825) O 0.008051 + 2.069(0.002825) O 0.008051 + 2.85(0.002825)
Step by Step Solution
There are 3 Steps involved in it

Get step-by-step solutions from verified subject matter experts