

Question: In the 1990s, e-mail started to be used as a communication tool in businesses. The average daily number of e-mails received by 3 businesses
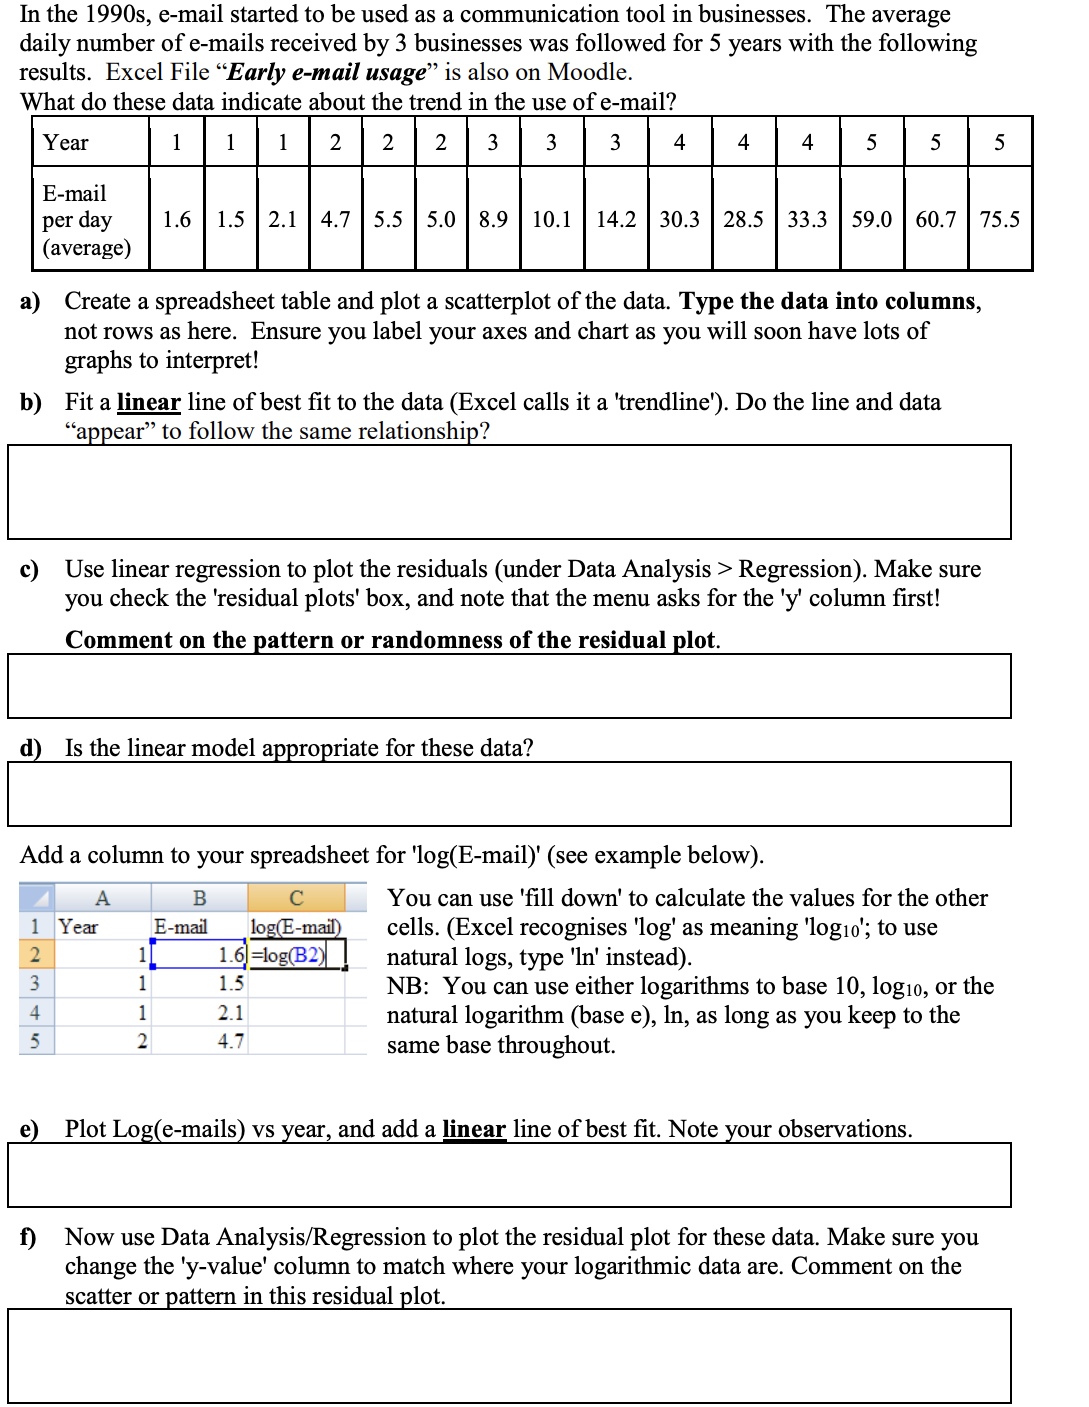
In the 1990s, e-mail started to be used as a communication tool in businesses. The average daily number of e-mails received by 3 businesses was followed for 5 years with the following results. Excel File "Early e-mail usage" is also on Moodle. What do these data indicate about the trend in the use of e-mail? Year E-mail per day (average) 1 1|1 2 2 2 3 3 3 4 4 4 5 5 5 1.6 1.5 2.1 4.7 5.5 5.0 8.9 10.1 14.2 30.3 28.5 33.3 59.0 60.7 75.5 a) Create a spreadsheet table and plot a scatterplot of the data. Type the data into columns, not rows as here. Ensure you label your axes and chart as you will soon have lots of graphs to interpret! b) Fit a linear line of best fit to the data (Excel calls it a 'trendline'). Do the line and data appear to follow the same relationship? c) Use linear regression to plot the residuals (under Data Analysis > Regression). Make sure you check the 'residual plots' box, and note that the menu asks for the 'y' column first! Comment on the pattern or randomness of the residual plot. d) Is the linear model appropriate for these data? Add a column to your spreadsheet for 'log(E-mail)' (see example below). 123 A B 1 Year E-mail 1] C log(E-mail) 1.6=log(B2) 1 1.5 4 1 2.1 5 2 4.7 You can use 'fill down' to calculate the values for the other cells. (Excel recognises 'log' as meaning 'log10'; to use natural logs, type 'ln' instead). NB: You can use either logarithms to base 10, log10, or the natural logarithm (base e), In, as long as you keep to the same base throughout. e) Plot Log(e-mails) vs year, and add a linear line of best fit. Note your observations. f) Now use Data Analysis/Regression to plot the residual plot for these data. Make sure you change the 'y-value' column to match where your logarithmic data are. Comment on the scatter or pattern in this residual plot. g) Is the plot of log(E-mail) against year a good linear relationship or not? h) What does your answer in g) indicate about the type of relationship between E-mails received and Year? i) From the best linear plot, obtain the equation for the most appropriate model. Note also the correlation coefficient. Remember if you plotted log(y), do include the 'log(E)' appropriately in the equation. Equation: r: R: j) If the equation includes a log(y), transform it back by reversing the logs. An example of reversing the logarithm in such an equation is Section 5 of the "Mathematical Modelling" Notes. NB: When reversing the logarithm, you must use the base used originally on the data transformation. k) What is the rate constant per year from this equation? AND calculate the doubling time for this e-mail growth. Is there any possible problem with this model for the growth of E-mail usage?
Step by Step Solution
There are 3 Steps involved in it

Get step-by-step solutions from verified subject matter experts