

Question: In the activity, you were asked to compare your data with a classmate, reflect on the conclusions given by that classmate to give feedback to
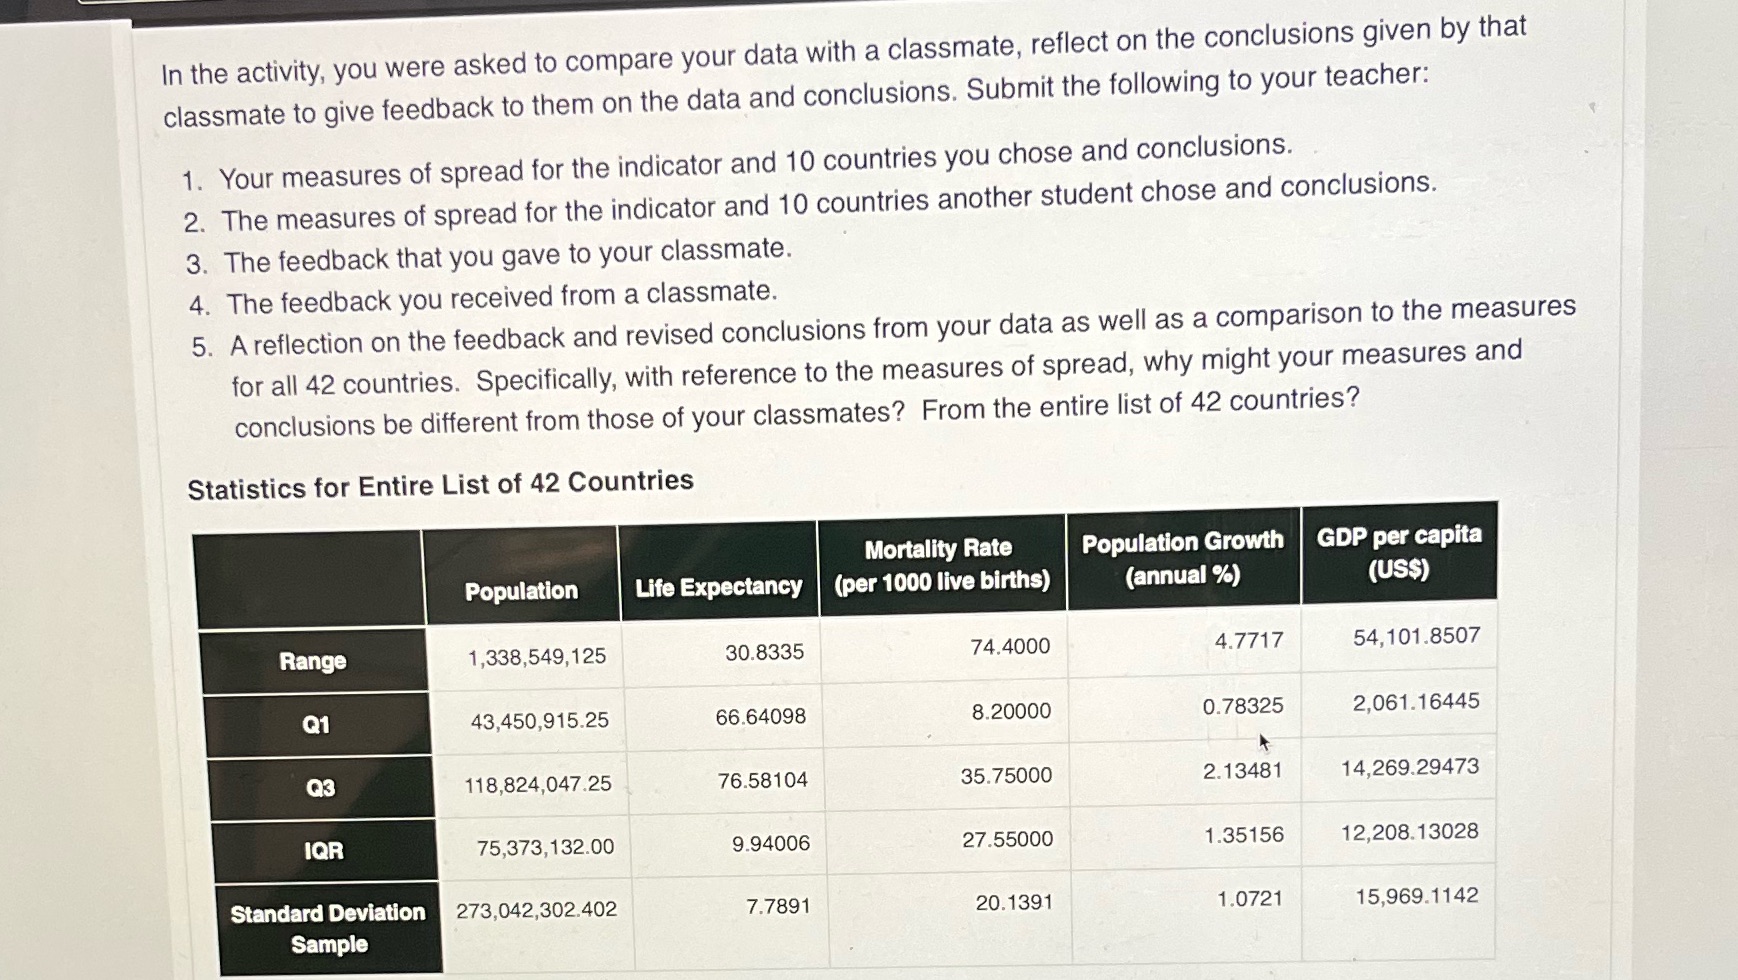
In the activity, you were asked to compare your data with a classmate, reflect on the conclusions given by that classmate to give feedback to them on the data and conclusions. Submit the following to your teacher: 1. Your measures of spread for the indicator and 10 countries you chose and conclusions. 2. The measures of spread for the indicator and 10 countries another student chose and conclusions. 3. The feedback that you gave to your classmate. 4. The feedback you received from a classmate. 5. A reflection on the feedback and revised conclusions from your data as well as a comparison to the measures for all 42 countries. Specifically, with reference to the measures of spread, why might your measures and conclusions be different from those of your classmates? From the entire list of 42 countries? Statistics for Entire List of 42 Countries Mortality Rate Population Growth GDP per capita Population Life Expectancy (per 1000 live births) (annual %) (US$) Range 1,338,549,125 30.8335 74.4000 4.7717 54, 101.8507 Q1 43,450,915.25 66.64098 8.20000 0.78325 2,061.16445 Q3 118,824,047.25 76.58104 35.75000 2.13481 14,269.29473 IQR 75,373, 132.00 9.94006 27.55000 1.35156 12,208.13028 Standard Deviation 273,042,302.402 7.7891 20.1391 1.0721 15,969.1142 Sample
Step by Step Solution
There are 3 Steps involved in it

Get step-by-step solutions from verified subject matter experts