

Question: In the below Lasso coefficient plot, how many coefficients contribute at a LI=5 ? Trace Pid of ceefidients it by Lasso Ans: In the plot
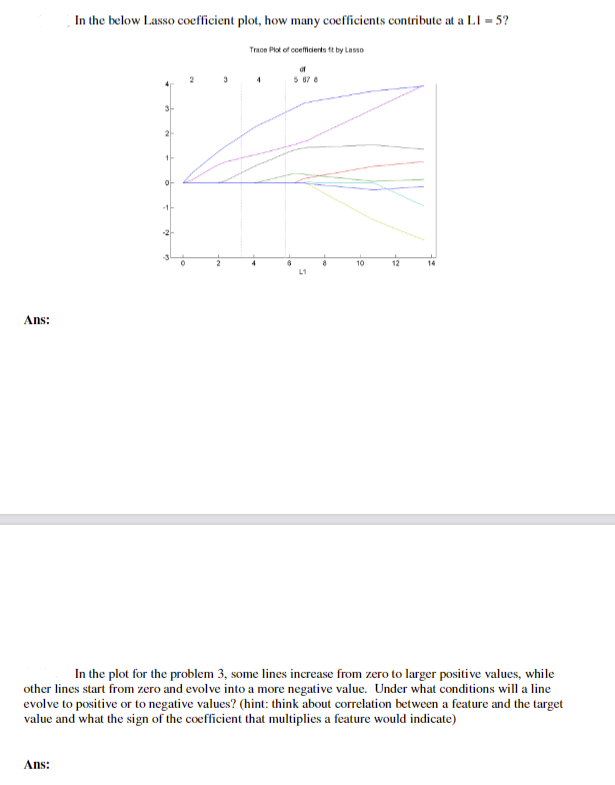
In the below Lasso coefficient plot, how many coefficients contribute at a LI=5 ? Trace Pid of ceefidients it by Lasso Ans: In the plot for the problem 3 , some lines increase from zero to larger positive values, while other lines start from zero and evolve into a more negative value. Under what conditions will a line evolve to positive or to negative values? (hint: think about correlation between a feature and the target value and what the sign of the coefficient that multiplies a feature would indicate)
Step by Step Solution
There are 3 Steps involved in it
1 Expert Approved Answer
Step: 1 Unlock

Question Has Been Solved by an Expert!
Get step-by-step solutions from verified subject matter experts
Step: 2 Unlock
Step: 3 Unlock