

Question: In the below table, which decomposes GDP by expenditure for the U.S. and China in 2006. Compute the ratio of saving to GDP for each
In the below table, which decomposes GDP by expenditure for the U.S. and China in 2006. Compute the ratio of saving to GDP for each economy.
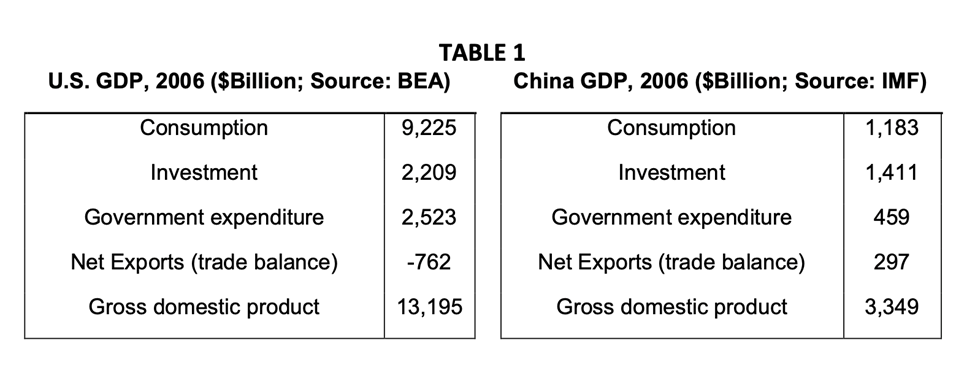
TABLE 1 U.S. GDP, 2006 ($Billion; Source: BEA) China GDP, 2006 ($Billion; Source: IMF) Consumption 9,225 Consumption 1,183 Investment 2,209 Investment 1,411 Government expenditure 2,523 Government expenditure 459 Net Exports (trade balance) -762 Net Exports (trade balance) 297 Gross domestic product 13,195 Gross domestic product 3,349
Step by Step Solution
There are 3 Steps involved in it
1 Expert Approved Answer
Step: 1 Unlock

Question Has Been Solved by an Expert!
Get step-by-step solutions from verified subject matter experts
Step: 2 Unlock
Step: 3 Unlock