

Question: In the Chapter 3 Applying Tableau, you compared two companies' profitability. For this case, you continue in your role as an analyst conducting research into
In the Chapter Applying Tableau, you compared two companies' profitability. For this case, you continue in your role as an analyst
conducting research into the relative merits of investing in one or both of these companies. You will assess the companies' fixed asset
turnover ratios to determine which company utilizes its fixed assets most efficiently to generate sales. The fixedasset turnover ratio is
calculated as net sales divided by average fixed assets.
Tableau Instructions:
For this case, you will create a calculation and produce bar charts of the fixedasset turnover ratio that allow you to compare and
contrast the two companies.
Use the following steps to create the charts you'll need for this case:
Download the Excel file "DiscountGoodsBigStoreFinancials."
Open Tableau and connect to the Excel file.
Click on the Sheet tab, at the bottom of the canvas, to the right of the Data Source at the bottom of the screen.
Drag "Company" and "Year" to the Rows shelf. Change "Year" to discrete by rightclicking and selecting "discrete."
Drag the "Average Fixed Assets" and "Net sales" under Measure Names to the Rows shelf. Change each to discrete.
Note: You must drag accounts into the Rows shelf if you are going to use them in calculated fields and need an aggregated sum. If
this is not done first, your answer will not match the solutions.
Under the Analysis tab, select Create Calculated Field. Create a measure named "Fixed Asset Turnover" by dragging "Net sales"
from the Rows shelf to the Calculation Editor window, typing a division sign for division, and then dragging "Average Fixed Assets"
from the Rows shelf beside it Make sure the window says that the calculation is valid and click OK
Drag the newly created "Fixed Asset Turnover" from Measure Names to the Rows shelf.
Rightclick the "Net sales" and "Average Fixed Assets" on the Rows shelf and unclick "Show header." This will hide these items from
view but still allow them to be used in the formulas.
Click on the "Show Me tab in the upper right corner and select "sidebyside bars." You should now see for each company, bars that
represent the Fixed Asset Turnover Ratio for each of the years of the dataset: to Add labels to the bars by clicking on
"Label" under the Marks card and clicking the box "Show mark label."
Change the title of the sheet to be "Fixed Asset Turnover Ratio Bar Chart" by doubleclicking the tab at the bottom of the page and
typing the new title.
Save your work.
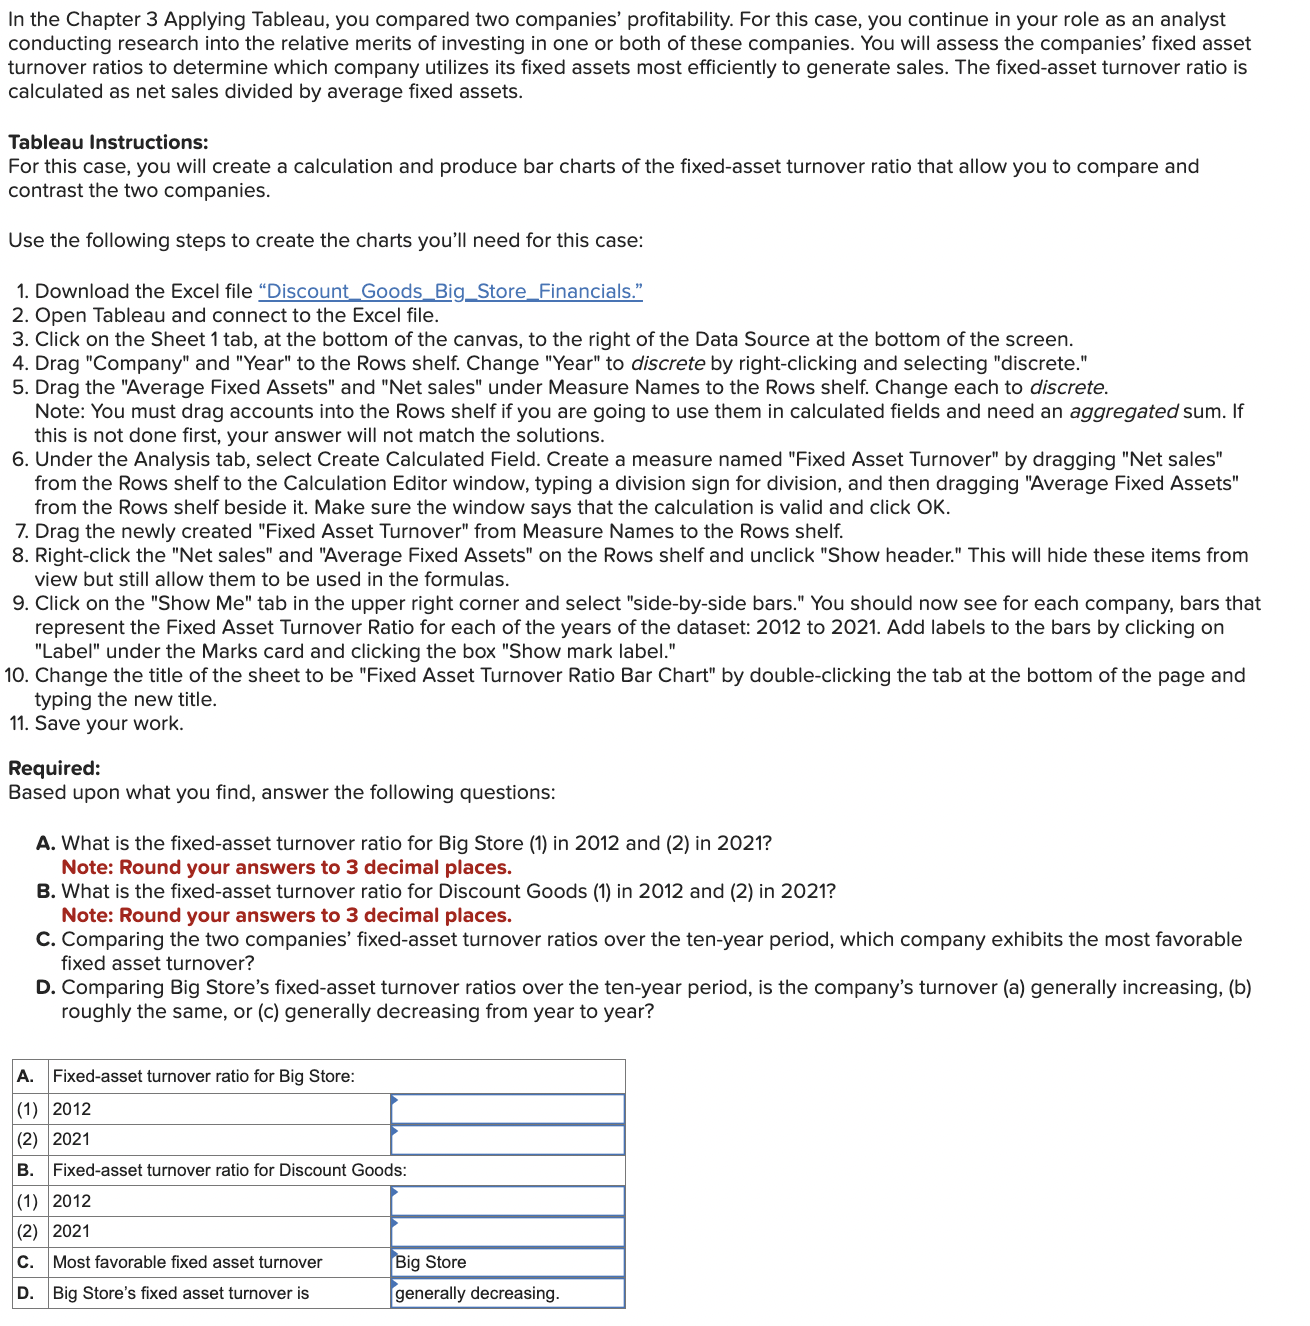
Required:
Based upon what you find, answer the following questions:
A What is the fixedasset turnover ratio for Big Store in and in
Note: Round your answers to decimal places.
B What is the fixedasset turnover ratio for Discount Goods in and in
Note: Round your answers to decimal places.
C Comparing the two companies' fixedasset turnover ratios over the tenyear period, which company exhibits the most favorable
fixed asset turnover?
D Comparing Big Store's fixedasset turnover ratios over the tenyear period, is the company's turnover a generally increasing, b
roughly the same, or c generally decreasing from year to year?
Step by Step Solution
There are 3 Steps involved in it
1 Expert Approved Answer
Step: 1 Unlock

Question Has Been Solved by an Expert!
Get step-by-step solutions from verified subject matter experts
Step: 2 Unlock
Step: 3 Unlock