

Question: In the control chart below, the LCL is 70, the UCL is 130, and the center line is 100. Does the chart indicate the process
In the control chart below, the LCL is 70, the UCL is 130, and the center line is 100.
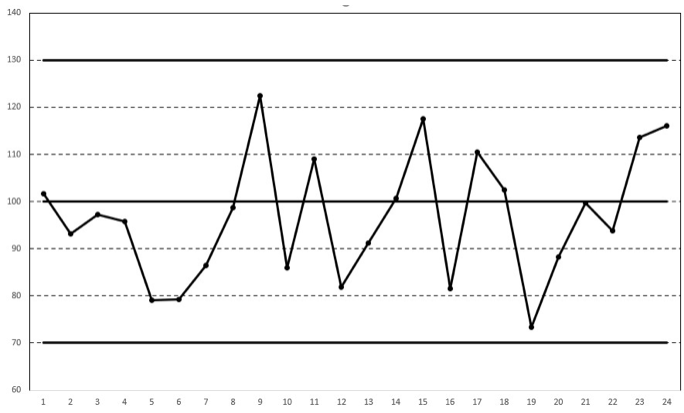
Does the chart indicate the process is in control or out of control? Enter "in" or "out" without the quotation marks. [inorout]
If your answer is "out", you will be asked to explain why in a later question.
140 130 120 110 100 TAN 90 80 70 60 1 2 3 4 8 10 11 12 13 14 15 16 17 18 19 20 21 22 23 24Step by Step Solution
There are 3 Steps involved in it
1 Expert Approved Answer
Step: 1 Unlock

Question Has Been Solved by an Expert!
Get step-by-step solutions from verified subject matter experts
Step: 2 Unlock
Step: 3 Unlock