

Question: In the data table below, the x-values are the weights [in pounds} of cars and the yvalues are the corresponding highway fuel consumption amounts [in
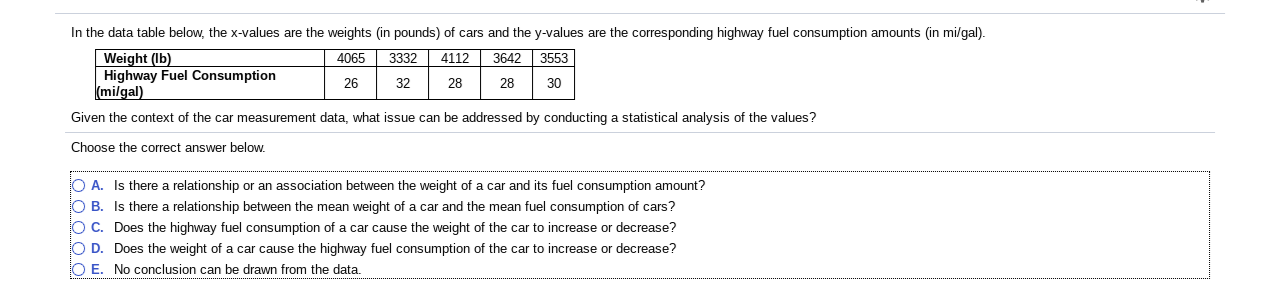
In the data table below, the x-values are the weights [in pounds} of cars and the yvalues are the corresponding highway fuel consumption amounts [in milgal). Weightb) 4065 3332 4112 3642 3553 limit]? Fuel Consumption 26 32 28 28 30 Given the context of the car measurement data, what issue can be addrased by conducting a statistical analysis of the values?I Choose the correct answer below. Is there a relationship or an association between the weight of a car and its fuel consumption amount? Is there a relationship between the mean weight of a car and the mean fuel cor'sumption of cars" Boa the highway fuel cor'sumption of a car cause the weight of the car to increase or decrease? Does the might of a car cause the highway fuel consumption of the car to increase or decrease? PPP
Step by Step Solution
There are 3 Steps involved in it

Get step-by-step solutions from verified subject matter experts