

Question: In the diagram below, the blue dots represent risks plotted based on their probability and impact. For which risks is it most likely that risk
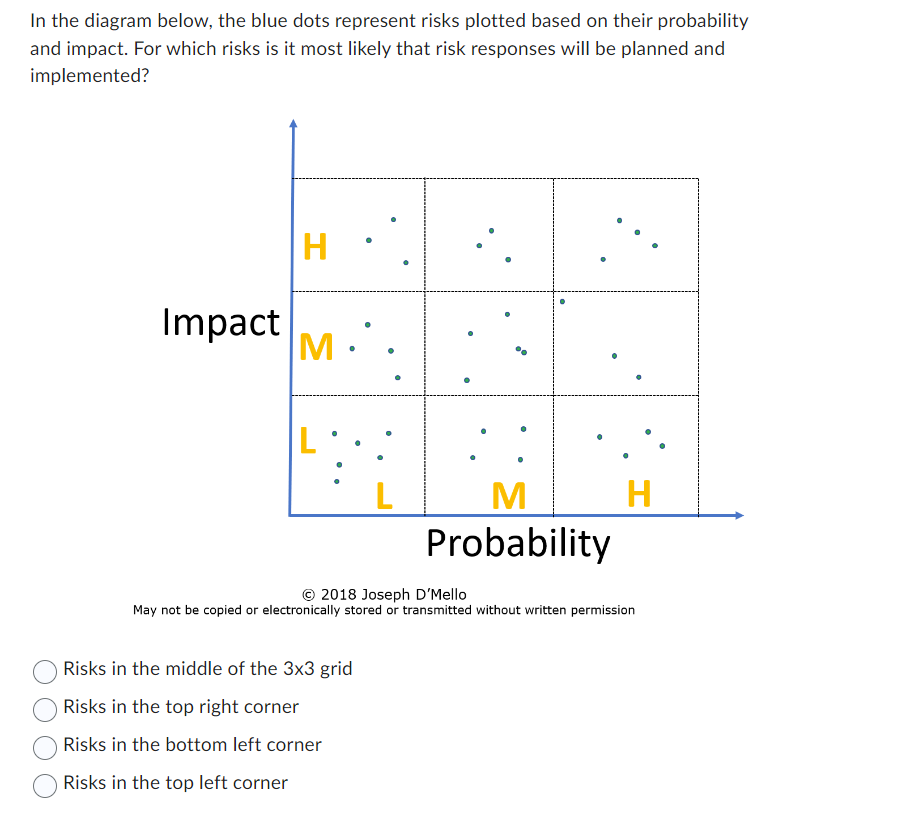

In the diagram below, the blue dots represent risks plotted based on their probability and impact. For which risks is it most likely that risk responses will be planned and implemented? Probability 2013 Joseph D'Mello May not be copied or electronically stored or transmitted wltheut written permission (22:. Risks in the middle of the 3x3 grid 0 Risks in the top right corner iii:3. Risks in the bottom left corner C3. Risks in the top left corner
Step by Step Solution
There are 3 Steps involved in it
1 Expert Approved Answer
Step: 1 Unlock

Question Has Been Solved by an Expert!
Get step-by-step solutions from verified subject matter experts
Step: 2 Unlock
Step: 3 Unlock