

Question: In the figure above, does the level 5 to level 2 transition (shown in (b)) or the level 3 to level 2 transition (shown in
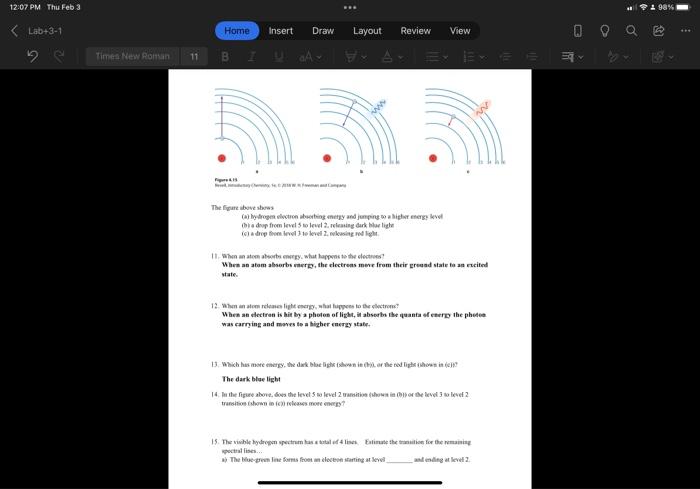
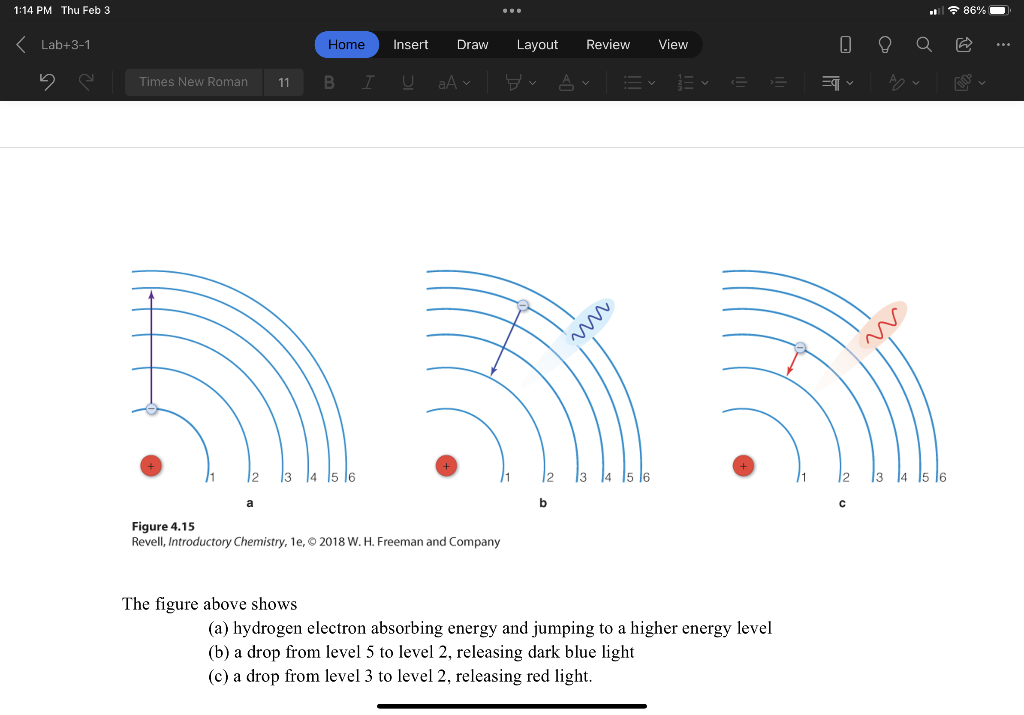
- In the figure above, does the level 5 to level 2 transition (shown in (b)) or the level 3 to level 2 transition (shown in (c)) releases more energy?
- The visible hydrogen spectrum has a total of 4 lines. Estimate the transition for the remaining spectral lines
a) The blue-green line forms from an electron starting at level ________ and ending at level 2.
b) The violet line forms from an electron drop starting at level ________ and ending at level 2.
12:07 PM Thu Feb 3 : 98% -
Step by Step Solution
There are 3 Steps involved in it
1 Expert Approved Answer
Step: 1 Unlock

Question Has Been Solved by an Expert!
Get step-by-step solutions from verified subject matter experts
Step: 2 Unlock
Step: 3 Unlock