

Question: In the following chart, fill in the missing cells for each of the following independent scenarios Do not enter dollar signs.or commas in the input
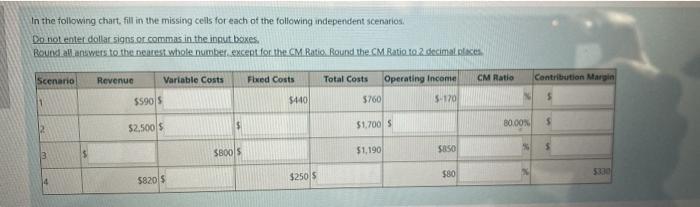
In the following chart, fill in the missing cells for each of the following independent scenarios Do not enter dollar signs.or commas in the input boxes. Roundhallanswers to the nearest whole number except for the CM Ratio Round the CM.Ratio 102 decimal places Scenario Revenue Variable costs Fixed Costs Total Costs Operating Income CM Ratio Contribution Margin 5 1 55905 $440 5760 5-170 $ 80.00% 12 $1.700 $2.500 5 $8005 $1,190 5850 $250 $ $80 5820 S 4
Step by Step Solution
There are 3 Steps involved in it
1 Expert Approved Answer
Step: 1 Unlock

Question Has Been Solved by an Expert!
Get step-by-step solutions from verified subject matter experts
Step: 2 Unlock
Step: 3 Unlock