

Question: In the following graph, three learning curves have been represented. The learning rates are 90%, 80% and 70%. Indicate which is the curve that represents
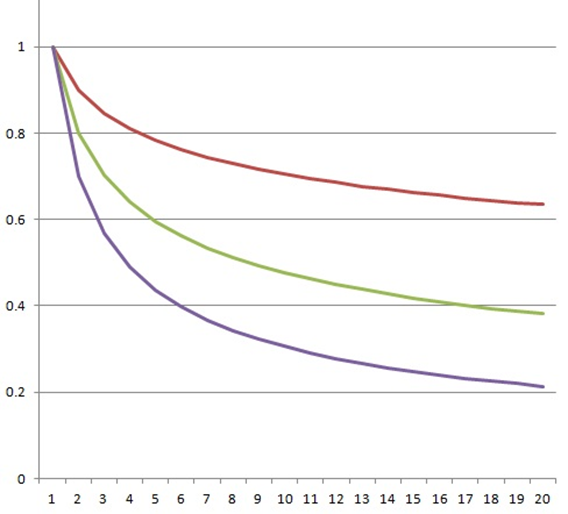
In the following graph, three learning curves have been represented. The learning rates are 90%, 80% and 70%. Indicate which is the curve that represents a 70% learning rate and calculate approximately the time spent in making a 7th system since the Y-axis indicates the value of N powered to the coefficient b and X-axis the number of units repeated.
\f
Step by Step Solution
There are 3 Steps involved in it
1 Expert Approved Answer
Step: 1 Unlock

Question Has Been Solved by an Expert!
Get step-by-step solutions from verified subject matter experts
Step: 2 Unlock
Step: 3 Unlock