

Question: In the following probability distribution, the random variable x represents the number of activities a parent of a 6th- to 8th-grade student is involved in.
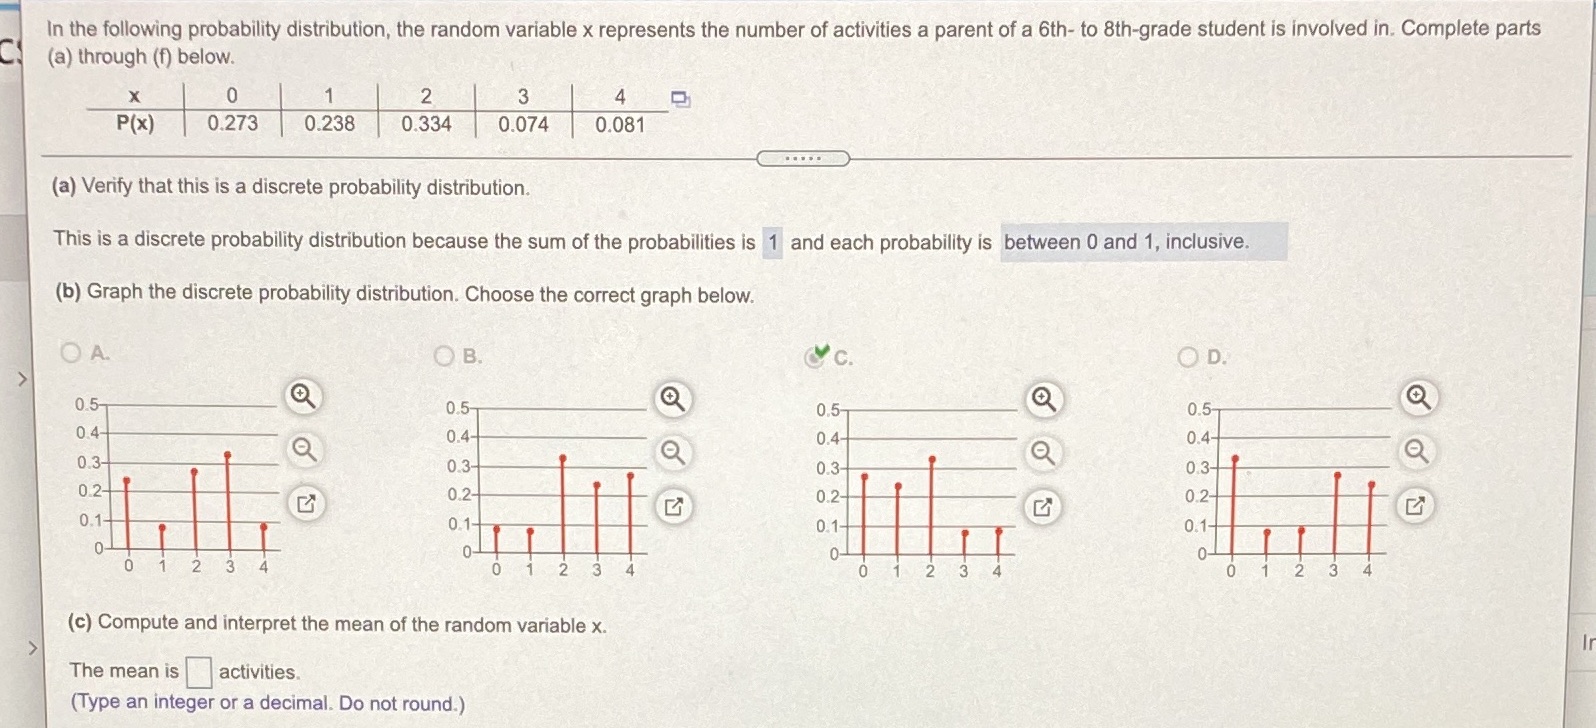
In the following probability distribution, the random variable x represents the number of activities a parent of a 6th- to 8th-grade student is involved in. Complete parts (a) through (f) below. X 0 1 2 3 4 P(x) 0.273 0.238 0.334 0.074 0.081 (a) Verify that this is a discrete probability distribution. This is a discrete probability distribution because the sum of the probabilities is 1 and each probability is between 0 and 1, inclusive. (b) Graph the discrete probability distribution. Choose the correct graph below. O A. OB. Cc. OD. 0.5- 0.5- 0.4- 0.5- 0.5- 0.2 (c) Compute and interpret the mean of the random variable x. The mean is activities. (Type an integer or a decimal. Do not round.)
Step by Step Solution
There are 3 Steps involved in it

Get step-by-step solutions from verified subject matter experts