

Question: In the frame below is a scatterplot of some 1990 US Census data population and housing. The variables, reported for each of the 50 states
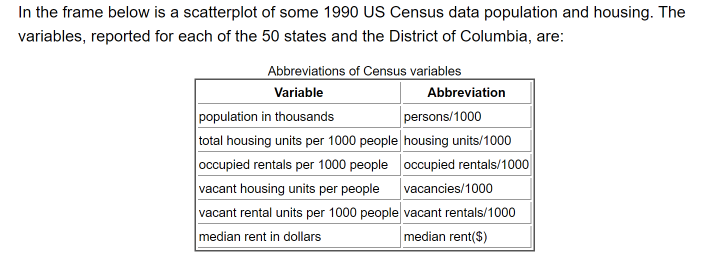
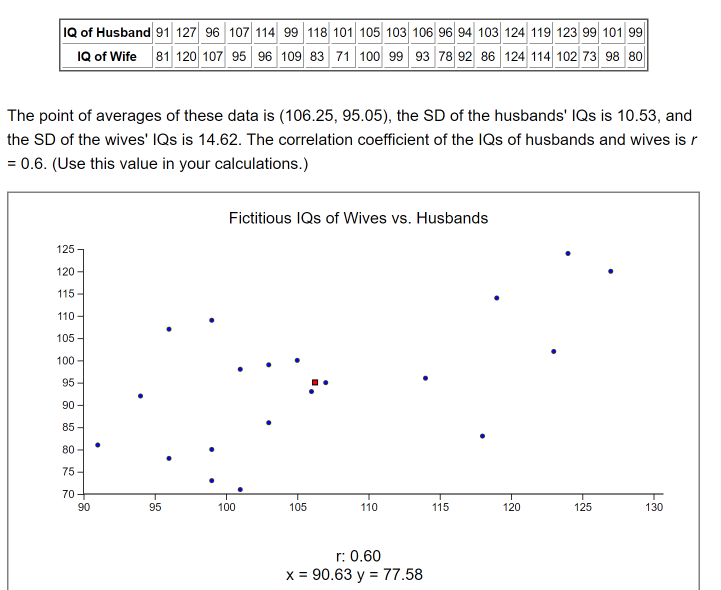
In the frame below is a scatterplot of some 1990 US Census data population and housing. The variables, reported for each of the 50 states and the District of Columbia, are: Abbreviations of Census variables Variable Abbreviation population in thousands persons/1000 total housing units per 1000 people housing units/1000 occupied rentals per 1000 people occupied rentals/1000 vacant housing units per people vacancies/1000 vacant rental units per 1000 people vacant rentals/1000 median rent in dollars median rent($)IQ of Husband 91 127 96 107 114 99 118 101 105 103 106 96 94 103 124 119 123 99 101 99 IQ of Wife 81 120 107 95 96 109 83 71 100 99 93 78 92 86 124 114 102 73 98 80 The point of averages of these data is (106.25, 95.05), the SD of the husbands' IQs is 10.53, and the SD of the wives' IQs is 14.62. The correlation coefficient of the IQs of husbands and wives is r = 0.6. (Use this value in your calculations.) Fictitious IQs of Wives vs. Husbands 125- 120 - 115 - 110 - 105 100 - 95 - . . 90 - 85 80 - 75 - 70- 90 95 100 105 110 115 120 125 130 r: 0.60 X = 90.63 y = 77.58
Step by Step Solution
There are 3 Steps involved in it

Get step-by-step solutions from verified subject matter experts