

Question: In the given dataset (0. STAT101 Project.xlsx) or (STAT101 Project MPJ), there are three variables; Child height (Child Height), Father height (Fheight) and Gender for
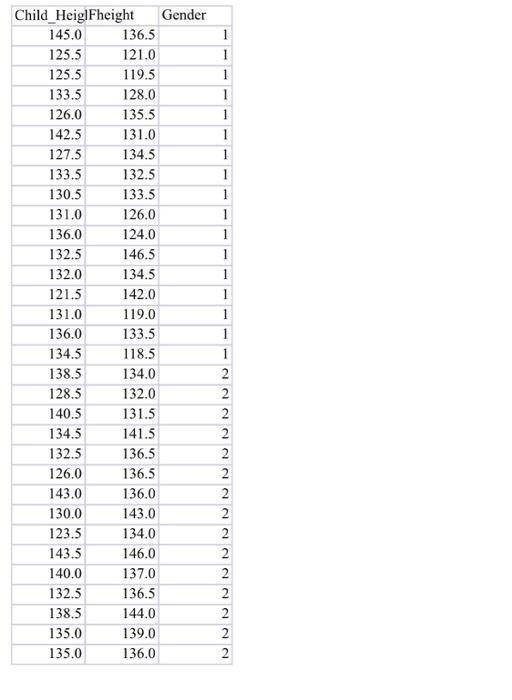
In the given dataset (0. STAT101 Project.xlsx) or (STAT101 Project MPJ), there are three variables;
Child height (Child Height), Father height (Fheight) and Gender for the child. Please do the following
using the Minitab software and interpret all the results.
1. Construct an appropriate chart represent the Cender
2. Construct a histogram (using 6 classes or groups) and a stem and leaf for the child height.
3. Describe the shape of the distribution in question2.
4. Are there any unusual observations for the Father height?
5. Construct the Box plot and Stem-Leave for the child's height,
6. Compute the upper and lower bounds of the IQR for the Father height.
7. Compute the mean and standard deviation for the child's height. 8. Test the normality for the child's height.
9. Estimate a 95% confidence interval for the child's height. Assume the population standard
deviation is 6.1. Interpret the results.
10. Do the dataset provide sufficient evidence that the average of the child's height is different from
140 cm? Using 1% significance level.
Step by Step Solution
There are 3 Steps involved in it

Get step-by-step solutions from verified subject matter experts