

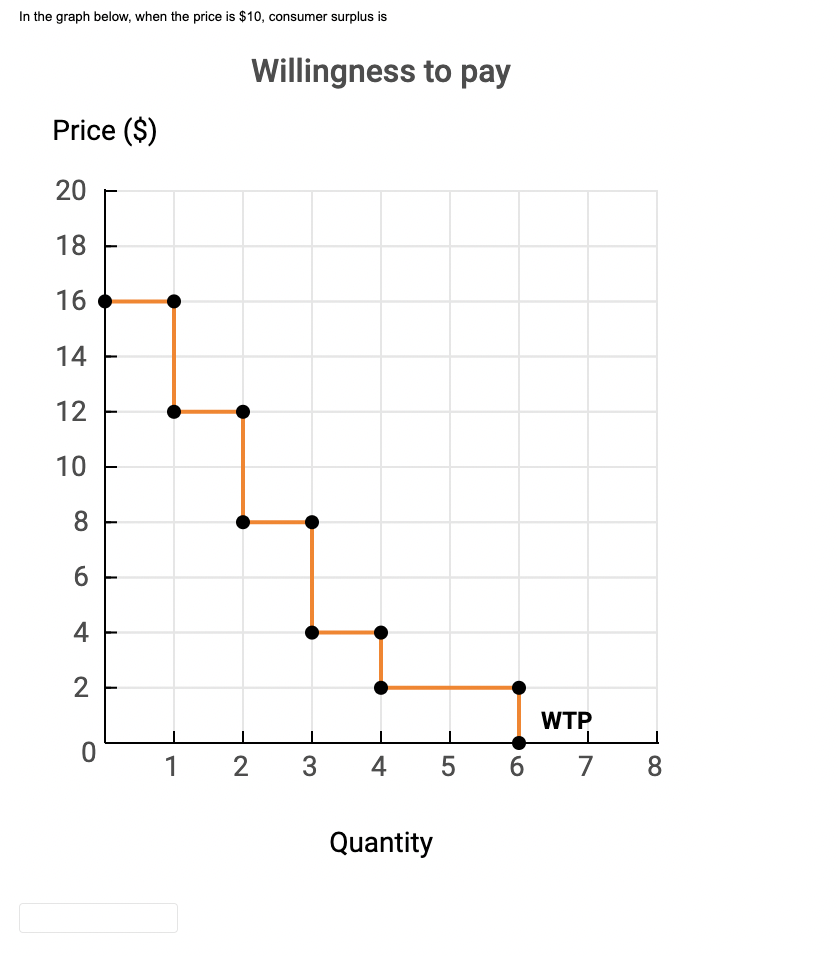
Question: In the graph below, when the price is $10, consumer surplus is Price ($) 20 18 1 6 14 12 'IO Willingness to pay Quantity

In the graph below, when the price is $10, consumer surplus is Price ($) 20 18 1 6 14 12 'IO Willingness to pay Quantity
Step by Step Solution
There are 3 Steps involved in it
1 Expert Approved Answer
Step: 1 Unlock

Question Has Been Solved by an Expert!
Get step-by-step solutions from verified subject matter experts
Step: 2 Unlock
Step: 3 Unlock