

In the graphics below, the yields (Y axis) of the 2 wheat types (A and B) in
Fantastic news! We've Found the answer you've been seeking!
Question:
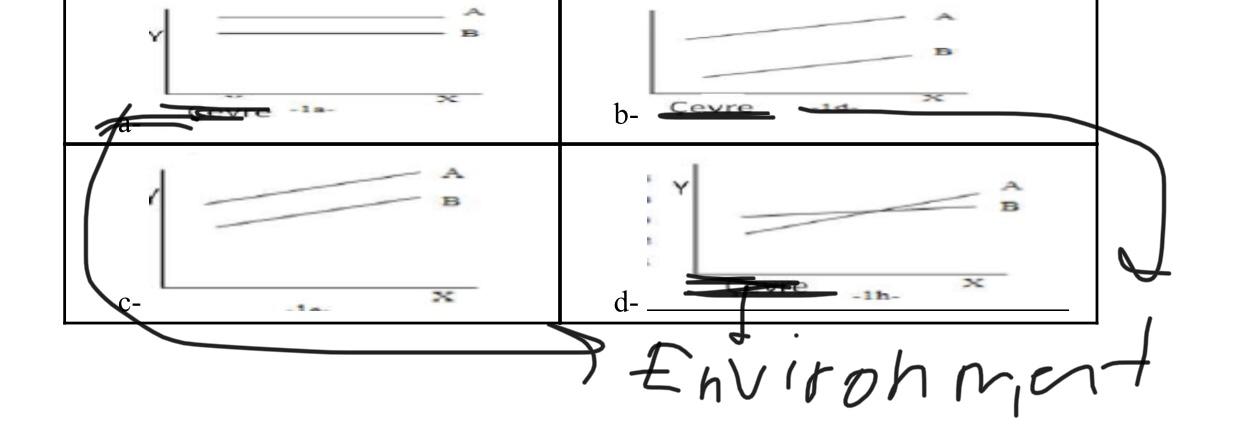 In the graphics below, the yields (Y axis) of the 2 wheat types (A and B) in different environment (X axis) are given. On which chart is genotype environmental interaction seen?
Expert Answer:

Related Book For 

Elementary Statistics
ISBN: 978-0538733502
11th edition
Authors: Robert R. Johnson, Patricia J. Kuby
Posted Date:
