

Question: In the graphs below, the vertical axis is x-position in meters and the horizontal axis is time in seconds. Which graph correctly shows the
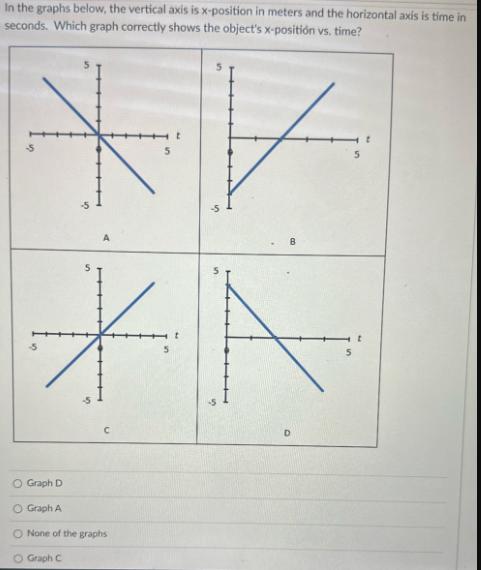
In the graphs below, the vertical axis is x-position in meters and the horizontal axis is time in seconds. Which graph correctly shows the object's x-positin vs. time? */ *A C O Graph D O Graph A O None of the graphs O Graph C D
Step by Step Solution
There are 3 Steps involved in it
1 Expert Approved Answer
Step: 1 Unlock

The detailed answer for the above question is provided below The correct answe... View full answer
Question Has Been Solved by an Expert!
Get step-by-step solutions from verified subject matter experts
Step: 2 Unlock
Step: 3 Unlock