

Question: In the Heart and Estrogen Replacement Study, a research question of interest was to quantify the effect of physical activity (1 to 5 increasing scale)
In the Heart and Estrogen Replacement Study, a research question of interest was to quantify the effect of physical activity (1 to 5 increasing scale) and drinking status (1=any drinking, 0 = no drinking) on serum glucose levels at year one of the study. These data were analyzed using two different models. Results from the analysis are provided below labeled SAS Output 1 and SAS Output 2. To answer some of the questions that follow, you need to fill in some critical pieces of information that have been deleted.
Q 45
Question 45
What type of analysis should you perform to test the given hypothesis?
Select one:
a. ANCOVA
b. Two-way ANOVA
c. Linear regression
d. Logistic Regression
e. One-way ANOVA
Q 46
Question 46
In SAS Output 2, what number should you insert for the Error degrees of freedom?
Select one:
a. 5
b. 2605
c. 2604
d. 2601
e. 2610
Q 47
Question 47
Which model is more appropriate for these data: the model in SAS Output 1 or the model in SAS Output 2? Which test statistic and p-value should you use to make this decision?
Select one:
a. Output 1 because the interaction is significant (F= 10.08,p-value
b. Output 1 because the interaction is significant (F= 30.59,p-value
c. Output 2 because the interaction is significant (F= 13.17,p-value
d. Output 1 because the interaction is not significant (F= 0.58,p-value = 0.6767).
e. Output 2 because the interaction is not significant (t= 1.14,p-value = 0.2547).
Q 48
Question 48
In SAS Output 1, what is the value of the error mean square?
Select one:
a. 1887.631
b. 19024.333
c. 33366.994
d. 1886.416
e. 5080948.439
Q 49
Question 49
In SAS Output 1, what is the value of the test statistic for the omnibus null hypothesis H0?
Select one:
a. 17.69
b. 10.08
c. 11.34
d. 35.74
e. 0.58
Q 50
Question 50
Do any of the 5 physical activity groups differ significantly in mean glucose?
Select one:
a. Yes, group 5 differs from all group significantly.
b. Yes, group 5 differs significantly from groups 1,2, and 3.
c. Yes, group 4 differs significantly from groups 1 and 2
d. Yes, group 3 and 1 differ significantly.
e. Choices b, c, and d are all true.
Q 51
Question 51
Consider the estimated model from SAS Output 1, which can be written as:
?=133.52-22.83*P5-19.185*P4-14.12*P3-9.58*P2-10.44*D1
The independent variables in the equation above are defined as follows:
- P5 = 1 if subject is in physical activity category 5, 0 otherwise
- P4 = 1 if subject is in physical activity category 4, 0 otherwise
- P3 = 1 if subject is in physical activity category 3, 0 otherwise
- P2 = 1 if subject is in physical activity category 2, 0 otherwise
- D1 = 1 if subject is a regular drinker, 0 otherwise
What is the mean glucose level at year 1 for a regular drinker who is in physical activity category 1?
Select one:
a. 128.30
b. 133.52
c. 123.08
d. 118.72
e. 114.18
Q 52
Question 52
What type of interaction is shown in the figure below?
Select one:
a. There is a same direction interaction.
b. There is a reverse interaction.
c. There is no interaction because the regression lines fit to the data are parallel.
d. There is no interaction because the differences in mean glucose between regular and irregular drinkers for each physical activity level are approximately equal
e. There is no interaction because the difference in mean glucose between regular and irregular drinkers depends strongly on physical activity level.
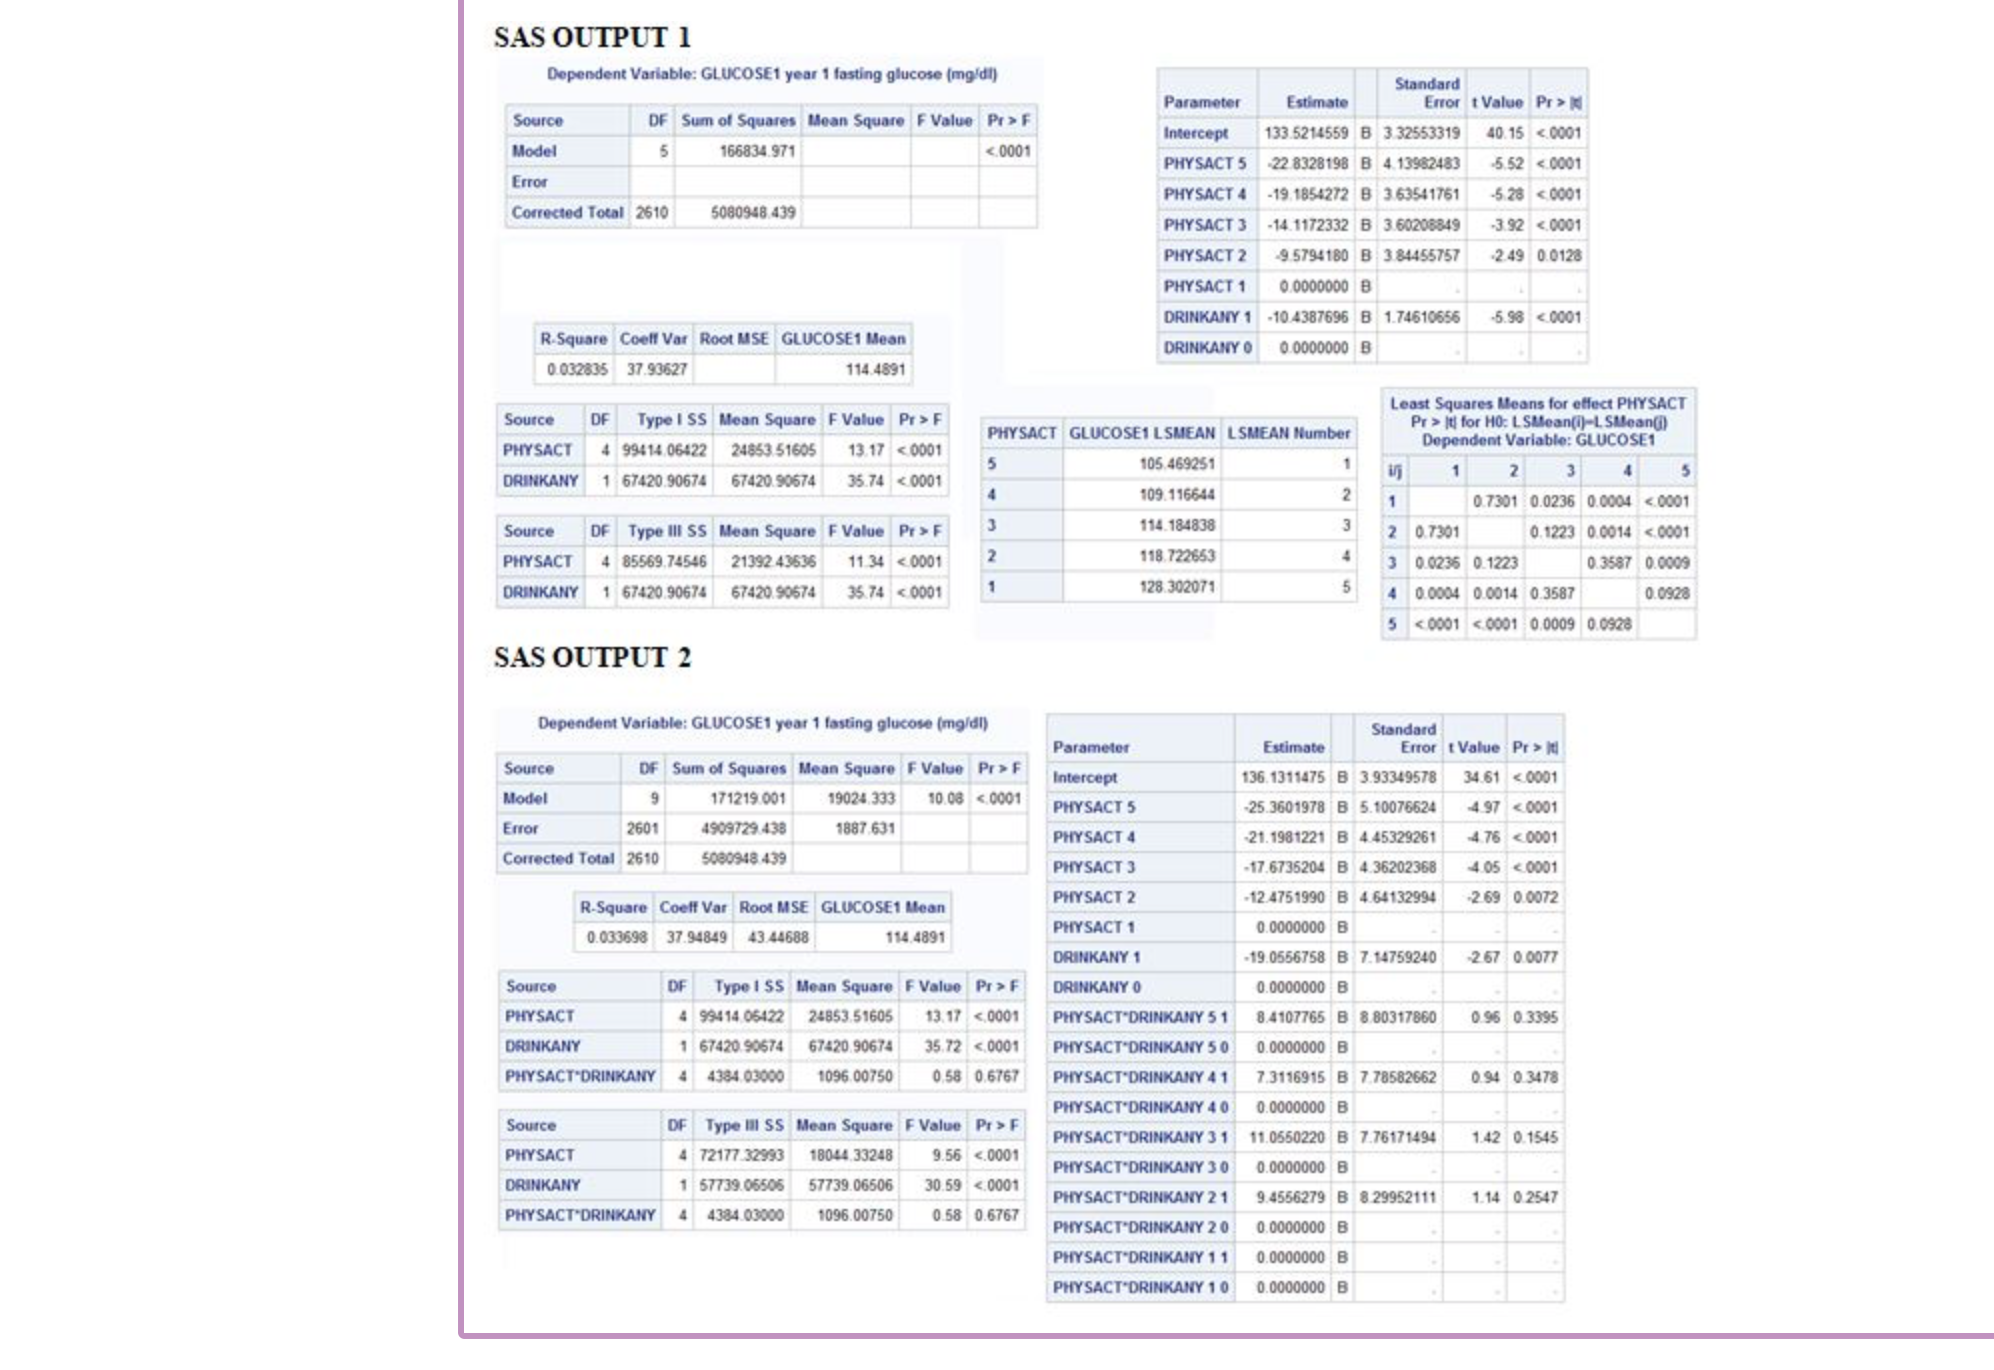
SAS OUTPUT 1 Dependent Variable: GLUCOSE1 year 1 fasting glucose (meidl) Standard DF Sum of Squares Mean Square F Value Pr > F Parameter Estimate Source Error t Value Pr > N 5 <.0001 intercept model physact b error corrected total .2.49 drinkany r.square coelf var root mse glucose1 mean source df type i ss square f value pr> F Least Squares Means for effect PHYSACT Pr > It for HO: L SMean(i)-LSMean() PHYSACT 4 99414.06422 24853 51605 13.17 <.0001 physact glucose1 lsmean number dependent variable: drinkany source df type lll ss mean square f value pr> F 114.184838 2 0.730 0.1223 0.0014 <.0001 physact drinkany sas output dependent variable: glucose1 year fasting glucose standard parameter estimate error t value pr> It Source DF Sum of Squares Mean Square F Value Pr > F Intercept 136.1311475 8 3.93349578 34.61 <.0001 model physact b error corrected total r-square coelf var root mse glucose1 mean .2 drinkany source of type ss square f value pr> F DRINKANY 0 0.0000000 B PHYSACT 4 99414 06422 24853.51605 13. 17 F PHYSACT.DRINKANY 40 0.0000000 B PHYSACT 18044.33248 PHYSACT'DRINKANY 3 1 11.0550220 B 7.76171494 1.42 0.1545 4 72177.32993 9.56 <.000 physact drinkany b physact.drinkany>
Step by Step Solution
There are 3 Steps involved in it

Get step-by-step solutions from verified subject matter experts