

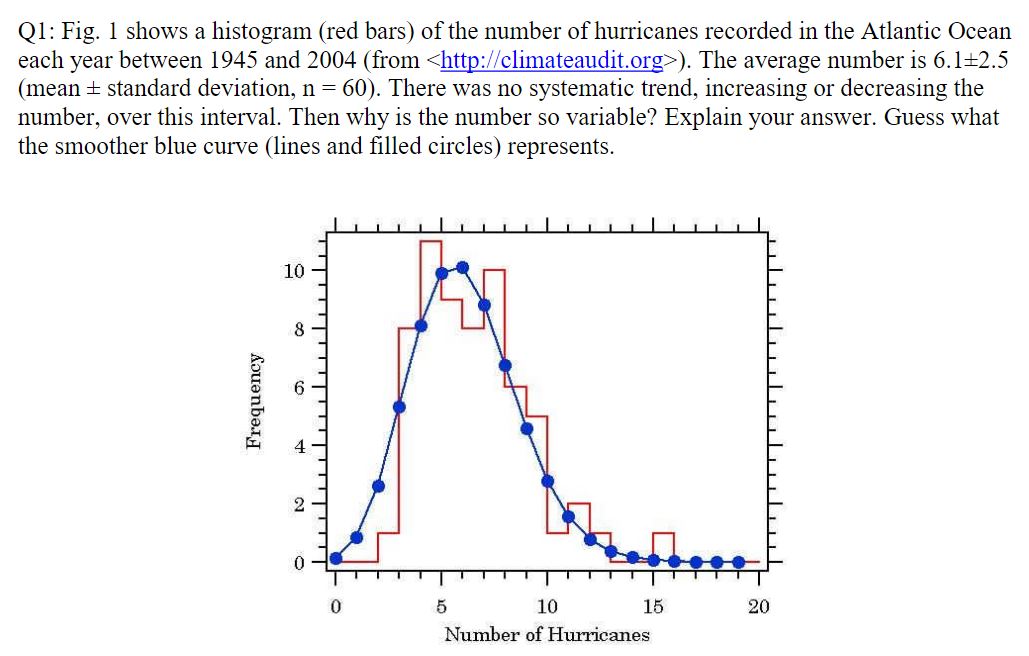
Question: In the histogram (attached), explain why the average number is so variable over the interval. Guess what the smoother blue curve (lines and filled circles)
In the histogram (attached), explain why the average number is so variable over the interval. Guess what the smoother blue curve (lines and filled circles) represents.
\f
Step by Step Solution
There are 3 Steps involved in it
1 Expert Approved Answer
Step: 1 Unlock

Question Has Been Solved by an Expert!
Get step-by-step solutions from verified subject matter experts
Step: 2 Unlock
Step: 3 Unlock