

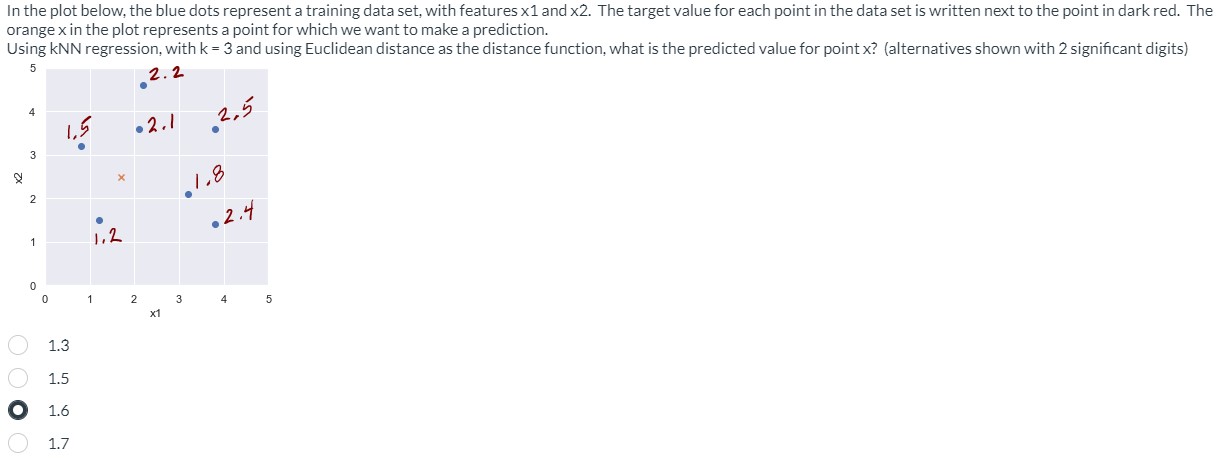
Question: In the plot below, the blue dots represent a training data set, with features x 1 and x 2 . The target value for each
In the plot below, the blue dots represent a training data set, with features and The target value for each point in the data set is written next to the point in dark red. The
orange in the plot represents a point for which we want to make a prediction.
Using regression, with and using Euclidean distance as the distance function, what is the predicted value for point alternatives shown with significant digits
Step by Step Solution
There are 3 Steps involved in it
1 Expert Approved Answer
Step: 1 Unlock

Question Has Been Solved by an Expert!
Get step-by-step solutions from verified subject matter experts
Step: 2 Unlock
Step: 3 Unlock