

Question: In the project network shown in the Figure below, the nodes are denoted by numbers and the activities by letters. The normal and crash
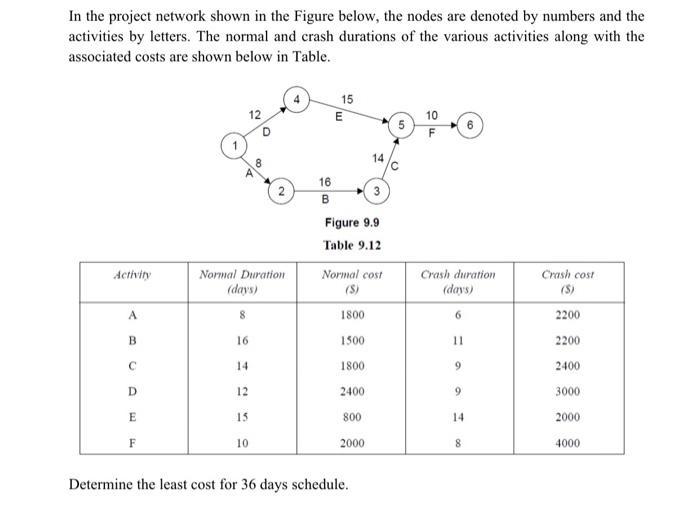
In the project network shown in the Figure below, the nodes are denoted by numbers and the activities by letters. The normal and crash durations of the various activities along with the associated costs are shown below in Table. 15 12 E 10 5 F 16 14 B Figure 9.9 Table 9.12 Activity Normal Duration (days) Normal cost Crash duration Crash cost (S) (days) (S) A 8 1800 6 2200 B 16 1500 2200 C 14 1800. 9 2400 D 12 2400 9 3000 E 15 800 14 2000 F 10 2000 8 4000 Determine the least cost for 36 days schedule.
Step by Step Solution
There are 3 Steps involved in it
1 Expert Approved Answer
Step: 1 Unlock

Question Has Been Solved by an Expert!
Get step-by-step solutions from verified subject matter experts
Step: 2 Unlock
Step: 3 Unlock