

In the short run, the quantity of output supplied by firms can deviate from the natural...
Fantastic news! We've Found the answer you've been seeking!
Question:
Transcribed Image Text:
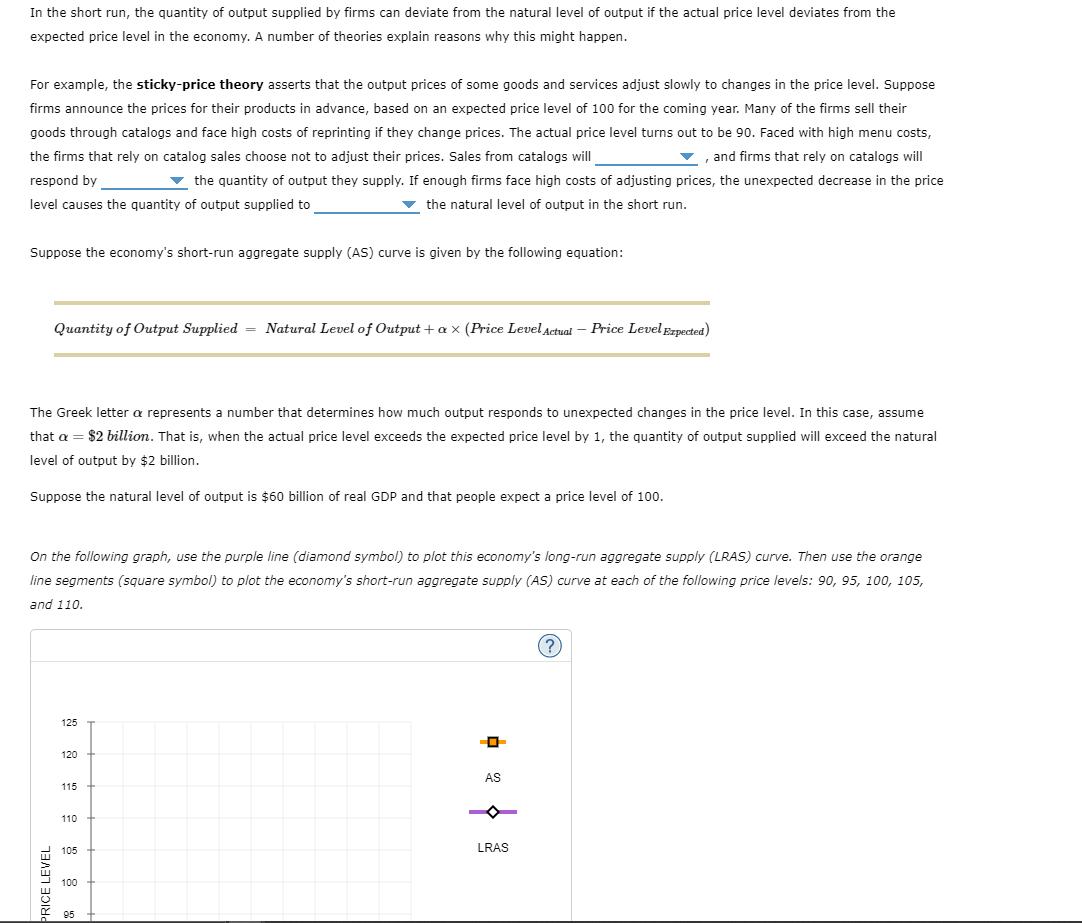
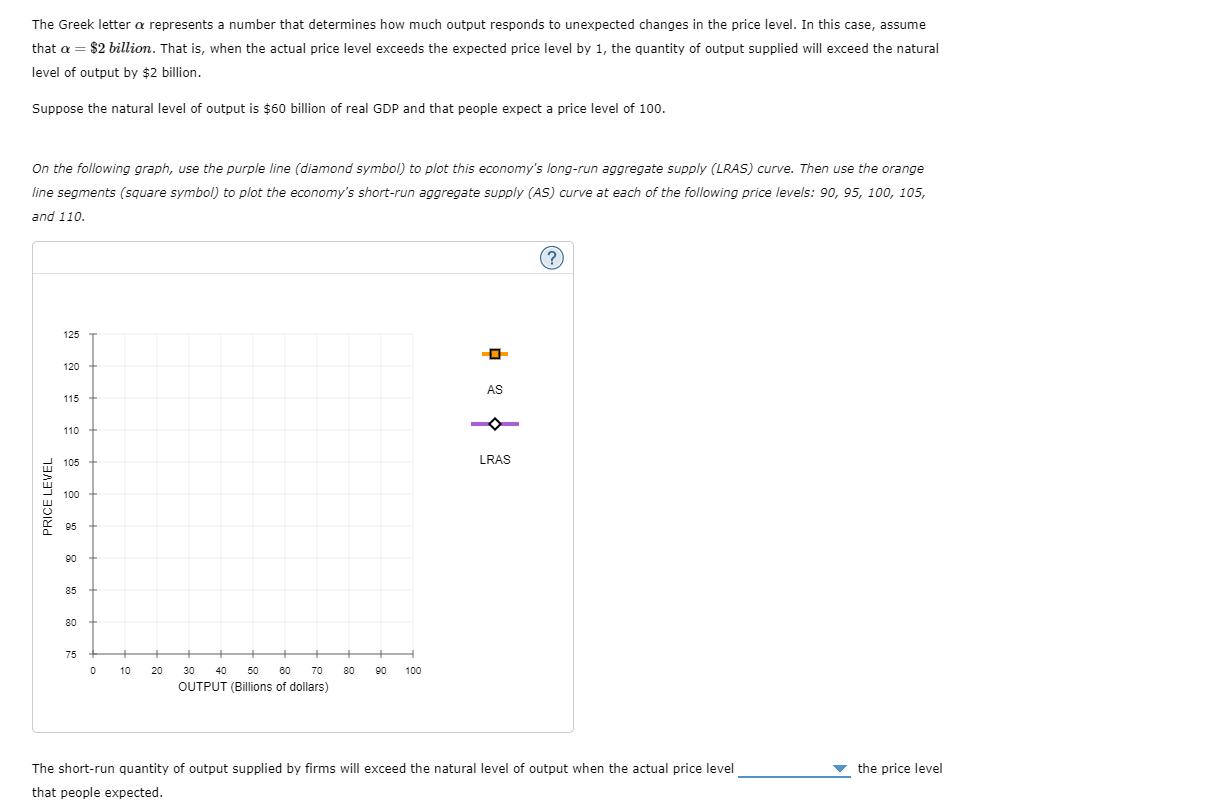
In the short run, the quantity of output supplied by firms can deviate from the natural level of output if the actual price level deviates from the expected price level in the economy. A number of theories explain reasons why this might happen. For example, the sticky-price theory asserts that the output prices of some goods and services adjust slowly to changes in the price level. Suppose firms announce the prices for their products in advance, based on an expected price level of 100 for the coming year. Many of the firms sell their goods through catalogs and face high costs of reprinting if they change prices. The actual price level turns out to be 90. Faced with high menu costs, the firms that rely on catalog sales choose not to adjust their prices. Sales from catalogs will ▼, and firms that rely on catalogs will respond by the quantity of output they supply. If enough firms face high costs of adjusting prices, the unexpected decrease in the price level causes the quantity of output supplied to the natural level of output in the short run. Suppose the economy's short-run aggregate supply (AS) curve is given by the following equation: Quantity of Output Supplied = Natural Level of Output + ax (Price Level Actual - Price Level Expected) The Greek letter a represents a number that determines how much output responds to unexpected changes in the price level. In this case, assume that a $2 billion. That is, when the actual price level exceeds the expected price level by 1, the quantity of output supplied will exceed the natural level of output by $2 billion. Suppose the natural level of output is $60 billion of real GDP and that people expect a price level of 100. On the following graph, use the purple line (diamond symbol) to plot this economy's long-run aggregate supply (LRAS) curve. Then use the orange line segments (square symbol) to plot the economy's short-run aggregate supply (AS) curve at each of the following price levels: 90, 95, 100, 105, and 110. PRICE LEVEL 125 120 115 110 105 100 95 O AS LRAS (?) The Greek letter a represents a number that determines how much output responds to unexpected changes in the price level. In this case, assume that a = $2 billion. That is, when the actual price level exceeds the expected price level by 1, the quantity of output supplied will exceed the natural level of output by $2 billion. Suppose the natural level of output is $60 billion of real GDP and that people expect a price level of 100. On the following graph, use the purple line (diamond symbol) to plot this economy's long-run aggregate supply (LRAS) curve. Then use the orange line segments (square symbol) to plot the economy's short-run aggregate supply (AS) curve at each of the following price levels: 90, 95, 100, 105, and 110. PRICE LEVEL 125 120 115 110 105 100 95 90 85 80 75 0 10 20 30 40 50 60 70 OUTPUT (Billions of dollars) 80 90 100 AS LRAS (?) The short-run quantity of output supplied by firms will exceed the natural level of output when the actual price level that people expected. the price level In the short run, the quantity of output supplied by firms can deviate from the natural level of output if the actual price level deviates from the expected price level in the economy. A number of theories explain reasons why this might happen. For example, the sticky-price theory asserts that the output prices of some goods and services adjust slowly to changes in the price level. Suppose firms announce the prices for their products in advance, based on an expected price level of 100 for the coming year. Many of the firms sell their goods through catalogs and face high costs of reprinting if they change prices. The actual price level turns out to be 90. Faced with high menu costs, the firms that rely on catalog sales choose not to adjust their prices. Sales from catalogs will ▼, and firms that rely on catalogs will respond by the quantity of output they supply. If enough firms face high costs of adjusting prices, the unexpected decrease in the price level causes the quantity of output supplied to the natural level of output in the short run. Suppose the economy's short-run aggregate supply (AS) curve is given by the following equation: Quantity of Output Supplied = Natural Level of Output + ax (Price Level Actual - Price Level Expected) The Greek letter a represents a number that determines how much output responds to unexpected changes in the price level. In this case, assume that a $2 billion. That is, when the actual price level exceeds the expected price level by 1, the quantity of output supplied will exceed the natural level of output by $2 billion. Suppose the natural level of output is $60 billion of real GDP and that people expect a price level of 100. On the following graph, use the purple line (diamond symbol) to plot this economy's long-run aggregate supply (LRAS) curve. Then use the orange line segments (square symbol) to plot the economy's short-run aggregate supply (AS) curve at each of the following price levels: 90, 95, 100, 105, and 110. PRICE LEVEL 125 120 115 110 105 100 95 O AS LRAS (?) The Greek letter a represents a number that determines how much output responds to unexpected changes in the price level. In this case, assume that a = $2 billion. That is, when the actual price level exceeds the expected price level by 1, the quantity of output supplied will exceed the natural level of output by $2 billion. Suppose the natural level of output is $60 billion of real GDP and that people expect a price level of 100. On the following graph, use the purple line (diamond symbol) to plot this economy's long-run aggregate supply (LRAS) curve. Then use the orange line segments (square symbol) to plot the economy's short-run aggregate supply (AS) curve at each of the following price levels: 90, 95, 100, 105, and 110. PRICE LEVEL 125 120 115 110 105 100 95 90 85 80 75 0 10 20 30 40 50 60 70 OUTPUT (Billions of dollars) 80 90 100 AS LRAS (?) The short-run quantity of output supplied by firms will exceed the natural level of output when the actual price level that people expected. the price level
Expert Answer:

Related Book For 

Posted Date:
Students also viewed these economics questions
-
1. In the classical model, it is thought that the long-run: A. and short-run aggregate supply curves are both upward sloping. B. aggregate supply curve is vertical and the short-run aggregate supply...
-
Planning is one of the most important management functions in any business. A front office managers first step in planning should involve determine the departments goals. Planning also includes...
-
To begin with, lets disregard the COVID-19 pandemic and its aftermath on the global economy. Prior to the pandemic, the majority of global economic disruptions over the past decades have been caused...
-
Consider a group of 12 employees of whom five are in management and seven do clerical work. Select at random a sample of size 4. What is the probability that there will be one manager in this sample?
-
The city of New Orleans is located at latitude 30oN. Use Figure 9 to find a function that models the number of hours of daylight at New Orleans as a function of the time of year. Use the fact that on...
-
To study damage to aircraft that collide with large birds, you design a test gun that will accelerate chicken-sized objects so that their displacement along the gun barrel is given by x = (9.0 X 10³...
-
What are the three steps that can be taken along a corporate eco-efficiency path? How are the five modules related to development of a measure of eco-efficiency?
-
Guardian Security Services was established on August 15, 2010, to provide security services. The services provided during the remainder of the month are listed below. Aug. 18. Issued Invoice No. 1 to...
-
An epicyclic, gear train, as shown in Fig.15.26 is composed of a fixed annular wheel A having 150teeth. The wheel A is meshing with wheel B which drives wheel D through an idle wheel C, D...
-
Pure Plant Beauty is a sole proprietorship that has a developed a new line of skin care and makeup that uses natural and organic ingredients. The company showed the following adjusted account...
-
The values of y. Yo, and t are given. For an equation of the form y=yo e, give the exact value of k in terms of natural logarithms. Yo=70, t= 100, y = 35 BOX k=0 (Use integers or fractions for any...
-
A 1 . 7 0 - m - diameter vat of liquid is 2 . 1 0 m deep. The pressure at the bottom of the vat is 1 . 3 0 atm . What is the mass of the liquid in the vat? Express your answer with the appropriate...
-
Identify one global social challenge/issue that has received media coverage in the US and another country of your choice. You may consider a personally relevant social challenge/issue such as social...
-
7. The so-called red tide is generally caused by which of the following organisms? a. Lichens b. Bacteria c. Pfiesteria d. Dinoflagellates 8. Algae that contain agar in their cell walls belong to a....
-
1 Solve: 7y+21y-12=-y+9y-20
-
Compare the impact of workplace conditions and human error on causing workplace accidents.
-
Interpol used as what CBRNE stood for but why would we, the United States, care what Interpol says it stands for when we have our own law that we must follow, plus, Interpol did not clearly add...
-
(a) Prove that form an orthonormal basis for R3 for the usual dot product. (b) Find the coordinates of v = (1, 1, 1)T relative to this basis. (c) Verify formula (5.5) in this particular case. 48-65...
-
In The Wealth of Nations, Adam Smith wrote, Every individual endeavors to employ his capital so that its produce may be of greatest value. He generally neither intends to promote the public interest,...
-
Why can a decrease in tax rates increase AS as well as AD, whereas an increase in government purchases will increase AD but not AS?
-
Draw the demand curves for the following goods. If the price of the first good listed rises, what will happen to the demand for the second good, and why? a. Hamburger and ketchup b. Coca-Cola and...
-
A ___________ chart is a histogram that can help you identify and prioritize problem areas. A. Pareto B. control C. run D. scatter
-
What are the Seven Basic Tools of Quality? If applicable, describe how you have you used these tools in the workplace.
-
Perform the monitoring and controlling tasks for one of the case studies provided in Appendix C. If you are working on a real team project, create relevant monitoring and controlling documents, such...

Study smarter with the SolutionInn App