

Question: In the state of Florida, elementary school performance is based on the average score obtained by students on a standardized exam, called the Florida Comprehensive
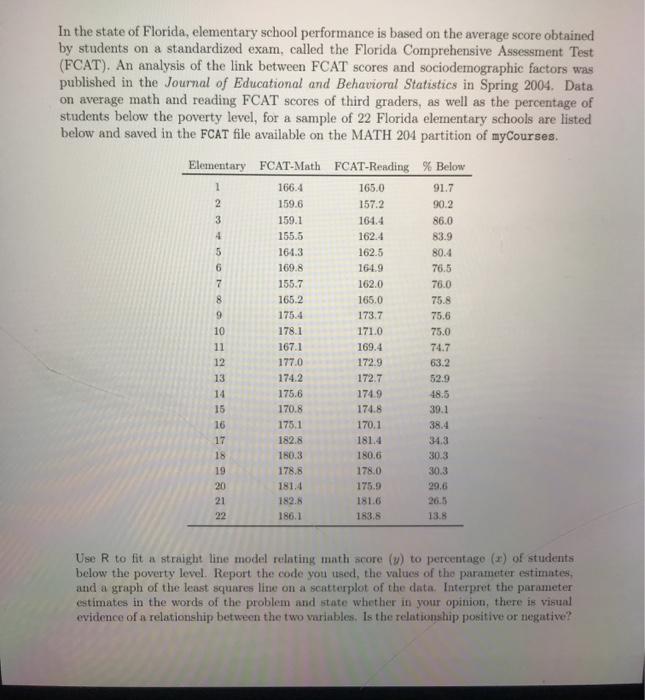
In the state of Florida, elementary school performance is based on the average score obtained by students on a standardized exam, called the Florida Comprehensive Assessment Test (FCAT). An analysis of the link between FCAT scores and sociodemographic factors was published in the Journal of Educational and Behavioral Statistics in Spring 2004. Data on average math and reading FCAT scores of third graders, as well as the percentage of students below the poverty level, for a sample of 22 Florida elementary schools are listed below and saved in the FCAT file available on the MATH 204 partition of myCourses. Elementary FCAT-Math FCAT-Reading % Below 165.0 91.7 157.2 90.2 159.1 86.0 162.4 1 2 166.4 159.6 3 164.4 1 5 6 7 8 9 10 11 12 13 14 15 16 17 18 19 20 21 22 155.5 164.3 169.8 155.7 165.2 175.4 178.1 167.1 177.0 174.2 175.6 170.8 175.1 182.8 180.3 178.8 181.4 182.5 186.1 162.5 161.9 162.0 165.0 173.7 171.0 169.4 172.9 172.7 174.9 174.8 170.1 181.4 180.6 178.0 175.9 181.6 183.8 83.9 80.4 76.5 76.0 75.8 75.6 75.0 74.7 63.2 52.9 48.5 39.1 38.4 34.3 30.3 30.3 29.6 26.5 13.8 Use R to fit a straight line model relating math score (v) to percentage (1) of students below the poverty level. Report the code you used the values of the parameter estimates, and a graph of the least squares line on a scatterplot of the data. Interpret the parameter estimates in the words of the problem and state whether in your opinion, there is visual evidence of a relationship between the two variables. Is the relationship positive or negative
Step by Step Solution
There are 3 Steps involved in it

Get step-by-step solutions from verified subject matter experts