

Question: In the Summary sheet, create a new column to the right of %Total Sales to Dealers Annual. Name it Top Model?. Format this column to
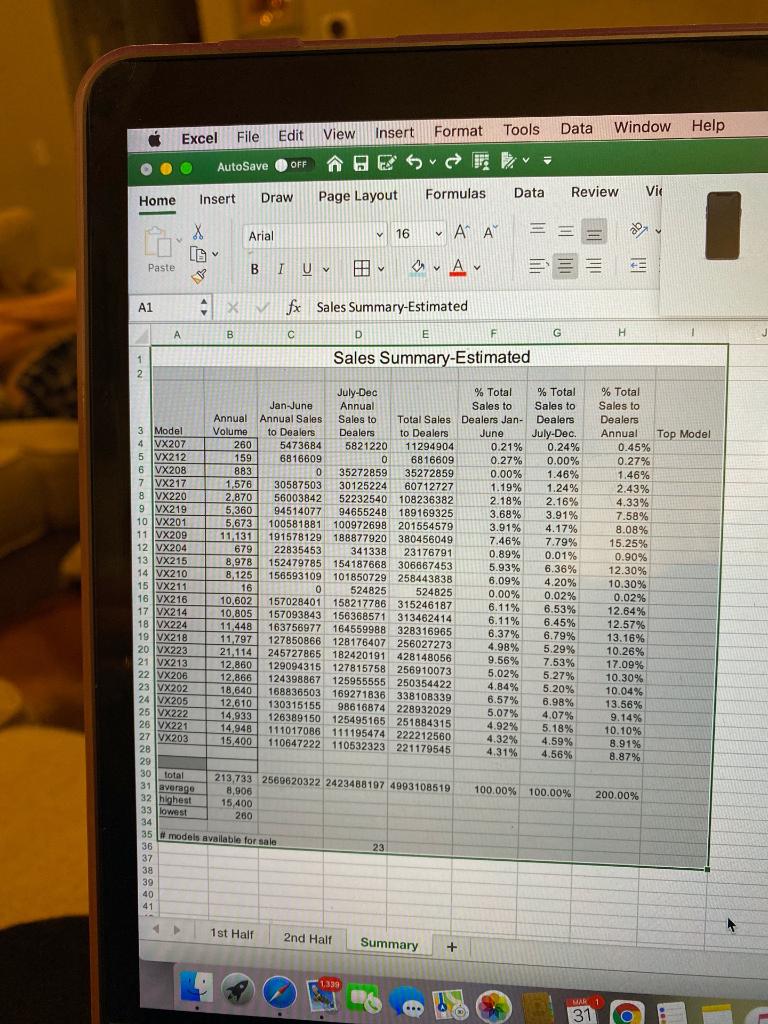
- In the Summary sheet, create a new column to the right of %Total Sales to Dealers Annual. Name it Top Model?. Format this column to have borders that match the rest of the table. Use a function to display TOP for each model that has a % of total sales greater than the average of the % total sales per model. What would the formula be.
Insert Format Tools Data Excel File Edit View Window Help AutoSave OFF Data Home Page Layout Review Formulas Vie Insert Draw X Arial 16 ' == Paste BIU V CA A1 Xfx fx Sales Summary-Estimated A B D E F G H 1 1 Sales Summary-Estimated 2. July-Dec % Total % Total Jan-June Annual Sales to Sales to Annual Annual Sales Sales to Total Sales Dealers Jan- Dealers 3 Model Volume to Dealers Dealers to Dealers June July-Dec. 4 VX207 260 5473684 5821220 11294904 0.21% 0.24% 5 VX212 159 6816609 0 6816609 0.27% 0.00% 6 VX208 883 0 35272859 35272859 0.00% 1.46% 7 VX217 1,576 30587503 30125224 60712727 1.19% 1.24% 8 IVX220 2,870 56003842 52232540 108236382 2.18% 2.16% 9 9 VX219 5,360 94514077 94655248 189169325 3.68% 3.91% 10 VX201 5,673 100581881 100972698 201554579 3.91% 4.17% 11 VX209 11,131 191578129 188877920 380456049 7.46% 7.79% 12 VX204 679 22835453 341338 23176791 0.89% 0.01% 13 VX215 8,978 152479785 154187668 154187668 306667453 5.93% 6.36% 14 VX210 8,125 156593109 101850729 258443838 6.09% 4.20% 15 VX211 16 0 524825 524825 0.00% 0.02% 16 VX216 10,602 157028401 158217786 315246187 6.11% 6.53% 17 VX214 10,805 157093843 156368571 313462414 6.11% 6.45% 18 VX224 11,448 163756977 164559988 328316965 6.37% 6.79% 19 VX218 11 797 127850866 128176407 256027273 4.98% 5.29% 20 VX223 21.114 245727865 182420191 428148056 9.56% 7.53% 21 VX213 12,860 129094315 127815758 256910073 5.02% 22 VX206 5.27% 12,866 124398867 125955555 250354422 4,84% 5.20% 23 VX202 18,640 168836503 169271836 338108339 24 VX205 6.57% 6.98% 12.610 130315155 98616874 228932029 25 VX222 5.07% 4.07% 14,933 126389150 125495165 251884315 26 VX221 4.92% 14,948 111017086 111195474 222212560 5.18% 27 VX203 4.32% 15,400 4.59% 110647222 110532323 221179545 28 4.31% 4.56% 29 30 total 213,733 2569620322 2423488197 4993108519 8,906 100.00% 100.00% 15 400 200 34 35 models available for sale 36 23 37 38 39 40 41 % Total Sales to Dealers Annual Top Model 0.45% 0.27% 1.46% 2.43% 4.33% 7.58% 8.08% 15.25% 0.90% 12.30% 10.30% 0.02% 12.64% 12.57% 13.16% 10.26% 17.09% 10.30% 10.04% 13.56% 9.14% 10.10% 8.91% 8.87% 31 average 32 highest 33 Lowest 200.00% 1st Half 2nd Half Summary + 1330 MAR 31 a Insert Format Tools Data Excel File Edit View Window Help AutoSave OFF Data Home Page Layout Review Formulas Vie Insert Draw X Arial 16 ' == Paste BIU V CA A1 Xfx fx Sales Summary-Estimated A B D E F G H 1 1 Sales Summary-Estimated 2. July-Dec % Total % Total Jan-June Annual Sales to Sales to Annual Annual Sales Sales to Total Sales Dealers Jan- Dealers 3 Model Volume to Dealers Dealers to Dealers June July-Dec. 4 VX207 260 5473684 5821220 11294904 0.21% 0.24% 5 VX212 159 6816609 0 6816609 0.27% 0.00% 6 VX208 883 0 35272859 35272859 0.00% 1.46% 7 VX217 1,576 30587503 30125224 60712727 1.19% 1.24% 8 IVX220 2,870 56003842 52232540 108236382 2.18% 2.16% 9 9 VX219 5,360 94514077 94655248 189169325 3.68% 3.91% 10 VX201 5,673 100581881 100972698 201554579 3.91% 4.17% 11 VX209 11,131 191578129 188877920 380456049 7.46% 7.79% 12 VX204 679 22835453 341338 23176791 0.89% 0.01% 13 VX215 8,978 152479785 154187668 154187668 306667453 5.93% 6.36% 14 VX210 8,125 156593109 101850729 258443838 6.09% 4.20% 15 VX211 16 0 524825 524825 0.00% 0.02% 16 VX216 10,602 157028401 158217786 315246187 6.11% 6.53% 17 VX214 10,805 157093843 156368571 313462414 6.11% 6.45% 18 VX224 11,448 163756977 164559988 328316965 6.37% 6.79% 19 VX218 11 797 127850866 128176407 256027273 4.98% 5.29% 20 VX223 21.114 245727865 182420191 428148056 9.56% 7.53% 21 VX213 12,860 129094315 127815758 256910073 5.02% 22 VX206 5.27% 12,866 124398867 125955555 250354422 4,84% 5.20% 23 VX202 18,640 168836503 169271836 338108339 24 VX205 6.57% 6.98% 12.610 130315155 98616874 228932029 25 VX222 5.07% 4.07% 14,933 126389150 125495165 251884315 26 VX221 4.92% 14,948 111017086 111195474 222212560 5.18% 27 VX203 4.32% 15,400 4.59% 110647222 110532323 221179545 28 4.31% 4.56% 29 30 total 213,733 2569620322 2423488197 4993108519 8,906 100.00% 100.00% 15 400 200 34 35 models available for sale 36 23 37 38 39 40 41 % Total Sales to Dealers Annual Top Model 0.45% 0.27% 1.46% 2.43% 4.33% 7.58% 8.08% 15.25% 0.90% 12.30% 10.30% 0.02% 12.64% 12.57% 13.16% 10.26% 17.09% 10.30% 10.04% 13.56% 9.14% 10.10% 8.91% 8.87% 31 average 32 highest 33 Lowest 200.00% 1st Half 2nd Half Summary + 1330 MAR 31 a
Step by Step Solution
There are 3 Steps involved in it

Get step-by-step solutions from verified subject matter experts