

Question: In the table below, you are given data for the country of Hemlock. National income $850 Personal income taxes 100 Other income not paid out
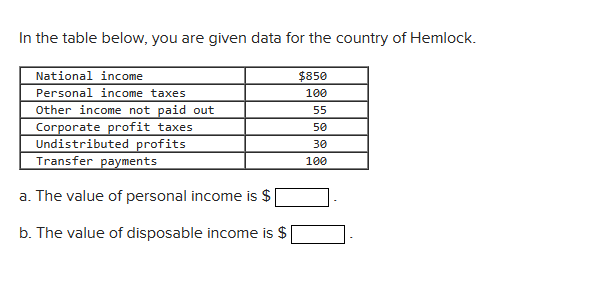
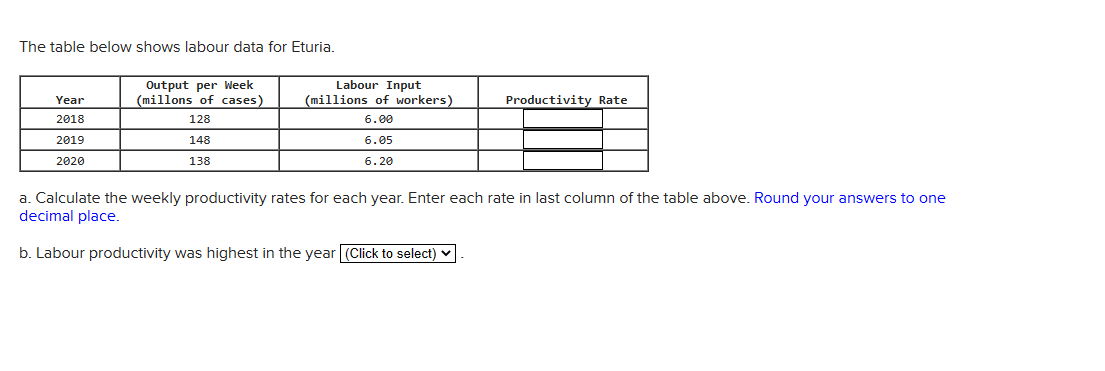
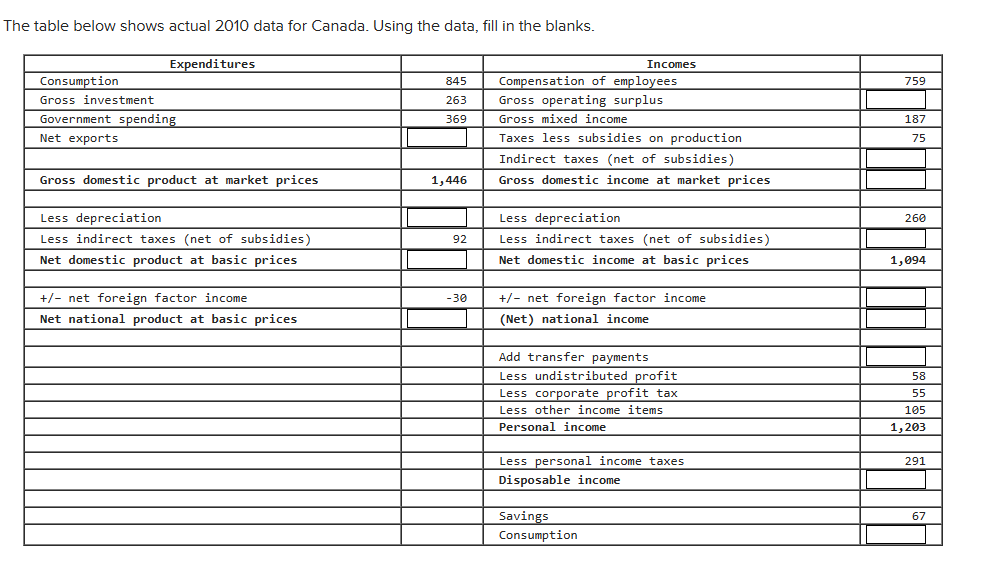
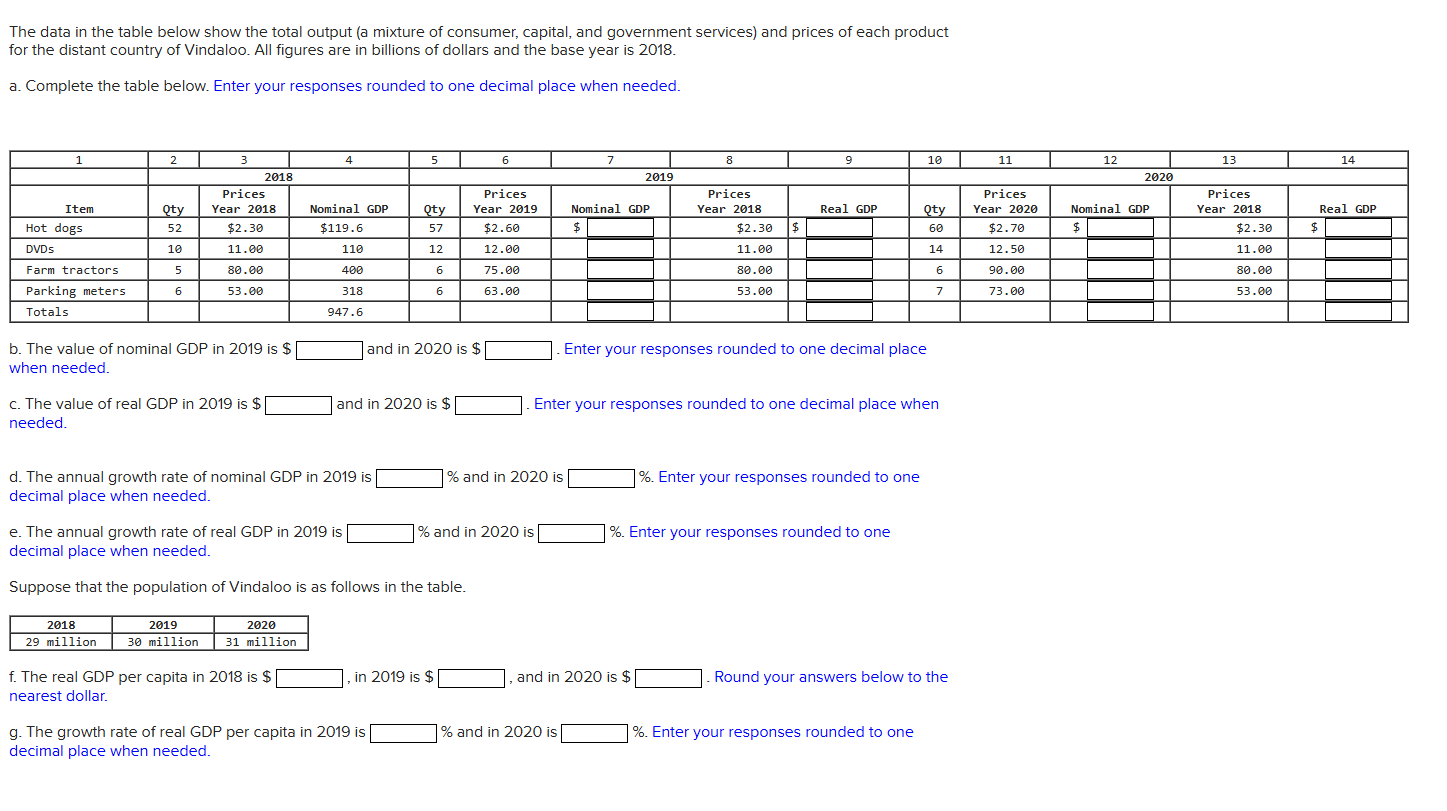
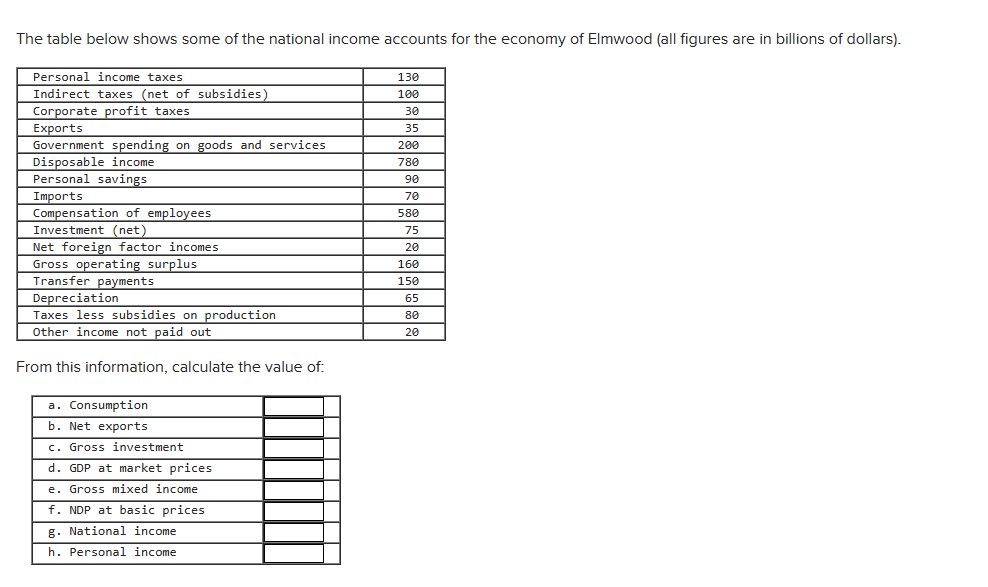
In the table below, you are given data for the country of Hemlock. National income $850 Personal income taxes 100 Other income not paid out 55 Corporate profit taxes 50 Undistributed profits 30 Transfer payments 100 a. The value of personal income is $ b. The value of disposable income is $The table below shows labour data for Eturia. Output per Week Labour Input Year (millons of cases) millions of workers) Productivity Rate 2018 128 6.00 2019 148 6.05 2020 138 6. 20 a. Calculate the weekly productivity rates for each year. Enter each rate in last column of the table above. Round your answers to one decimal place. b. Labour productivity was highest in the year (Click to select) vThe table below shows actual 2010 data for Canada. Using the data, fill in the blanks. Expenditures Incomes Consumption 845 Compensation of employees 759 Gross investment 263 Gross operating surplus Government spending 369 Gross mixed income 187 Net exports Taxes less subsidies on production 75 Indirect taxes (net of subsidies) Gross domestic product at market prices 1, 446 Gross domestic income at market prices Less depreciation Less depreciation 260 Less indirect taxes (net of subsidies) 92 Less indirect taxes (net of subsidies) Net domestic product at basic prices Net domestic income at basic prices 1, 094 +/- net foreign factor income -30 +/- net foreign factor income Net national product at basic prices (Net) national income Add transfer payments Less undistributed profit 58 Less corporate profit tax 55 Less other income items 105 Personal income 1, 203 Less personal income taxes 291 Disposable income Savings 67 ConsumptionThe data in the table below show the total output (a mixture of consumer, capital, and government services) and prices of each product for the distant country of Vindaloo. All figures are in billions of dollars and the base year is 2018. a. Complete the table below. Enter your responses rounded to one decimal place when needed. 2 3 5 6 8 9 10 11 12 13 14 2018 2019 2020 Prices Prices Prices Prices Prices Item Qty Year 2018 Nominal GDP Qty Year 2019 Nominal GDP Year 2018 Real GDP Qty Year 2020 Nominal GDP Year 2018 Real GDP Hot dogs 52 $2.30 $119.6 57 $2.60 $ $2.30 $ 60 $2.70 $ $2.30 $ DVD 16 11.00 110 12 12.00 11.00 14 12.50 11.00 Farm tractors unT 80.00 400 6 75.00 80.00 6 90.00 80.00 Parking meters 6 53.00 318 6 63.00 53.00 7 73.00 53.00 Totals 947.6 b. The value of nominal GDP in 2019 is $ and in 2020 is $ . Enter your responses rounded to one decimal place when needed. c. The value of real GDP in 2019 is $[ and in 2020 is $ . Enter your responses rounded to one decimal place when needed. d. The annual growth rate of nominal GDP in 2019 is [ % and in 2020 is %. Enter your responses rounded to one decimal place when needed. e. The annual growth rate of real GDP in 2019 is % and in 2020 is %. Enter your responses rounded to one decimal place when needed. Suppose that the population of Vindaloo is as follows in the table. 2018 2019 2020 29 million 30 million 31 million f. The real GDP per capita in 2018 is $ , in 2019 is $ , and in 2020 is $ . Round your answers below to the nearest dollar. g. The growth rate of real GDP per capita in 2019 is 1% and in 2020 is %. Enter your responses rounded to one decimal place when needed.The table below shows some of the national income accounts for the economy of Elmwood (all figures are in billions of dollars). Personal income taxes 130 Indirect taxes (net of subsidies) 100 Corporate profit taxes 30 Exports 35 Government spending on goods and services 200 Disposable income 786 Personal savings 90 Imports 70 Compensation of employees 580 Investment (net) 75 Net foreign factor incomes 20 Gross operating surplus 160 Transfer payments 150 Depreciation 65 Taxes less subsidies on production 80 Other income not paid out 20 From this information, calculate the value of: a. Consumption b. Net exports c. Gross investment d. GDP at market prices e. Gross mixed income f. NDP at basic prices g. National income h. Personal income
Step by Step Solution
There are 3 Steps involved in it

Get step-by-step solutions from verified subject matter experts