

Question: In the three graphs below (labelled (b), (c) and (t) in Figure 1: Risk exposure by county), you can see three sets of weather-related risks
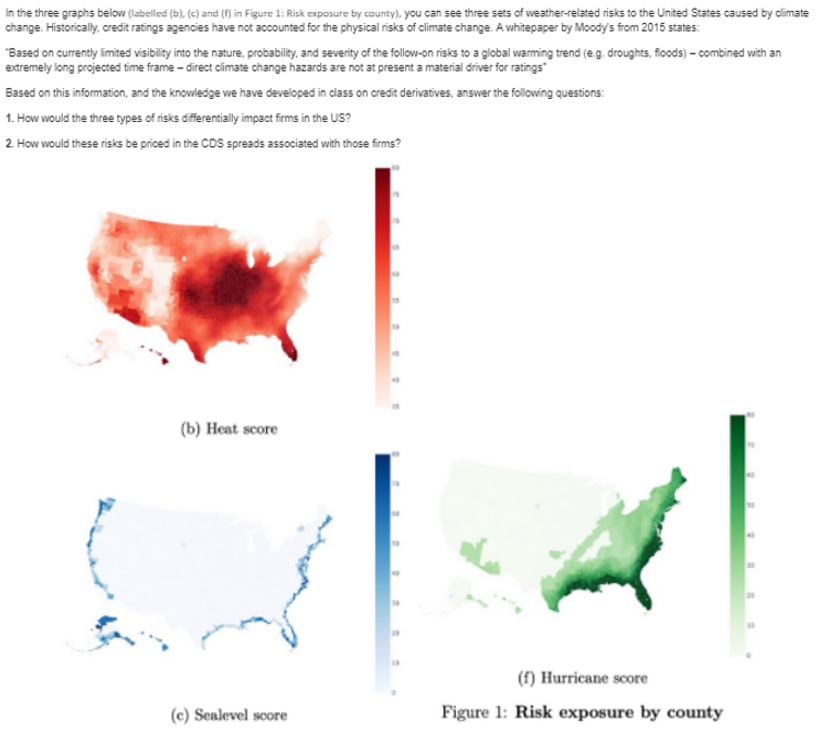
In the three graphs below (labelled (b), (c) and (t) in Figure 1: Risk exposure by county), you can see three sets of weather-related risks to the United States caused by climate change. Historically, credit ratings agencies have not accounted for the physical risks of climate change. A whitepaper by Moody's from 2015 states "Based on currently limited visibility into the nature, probability, and severity of the follow-on risks to a global warming trend (e.g. droughts, floods) - combined with an extremely long projected time frame - direct climate change hazards are not at present a material driver for ratings Based on this information, and the knowledge vue have developed in class on credit derivatives, answer the following questions: 1. How would the three types of risks differentially impact firms in the US? 2. How would these risks be priced in the CDS spreads associated with those firms? (b) Heat score (f) Hurricane score Figure 1: Risk exposure by county (e) Sealevel score In the three graphs below (labelled (b), (c) and (t) in Figure 1: Risk exposure by county), you can see three sets of weather-related risks to the United States caused by climate change. Historically, credit ratings agencies have not accounted for the physical risks of climate change. A whitepaper by Moody's from 2015 states "Based on currently limited visibility into the nature, probability, and severity of the follow-on risks to a global warming trend (e.g. droughts, floods) - combined with an extremely long projected time frame - direct climate change hazards are not at present a material driver for ratings Based on this information, and the knowledge vue have developed in class on credit derivatives, answer the following questions: 1. How would the three types of risks differentially impact firms in the US? 2. How would these risks be priced in the CDS spreads associated with those firms? (b) Heat score (f) Hurricane score Figure 1: Risk exposure by county (e) Sealevel score
Step by Step Solution
There are 3 Steps involved in it

Get step-by-step solutions from verified subject matter experts