

Question: In this assignment, you are responsible for creating a data set and drawing x and R charts in MS Excel. Please follow the instructions below.
In this assignment, you are responsible for creating a data set and drawing x and R charts in MS Excel.
Please follow the instructions below.
- The control limit is 99.73%, the population standard deviation is 17, and the population mean is 73.
- Calculate the UCLx and LCLx for the x chart.
- Your sample size is 10.
- Use the RANDBETWEEN function to generate random numbers between 40% more than the UCL and 40% less than the LCL. Your table will generate random and different numbers but should look like the following table. However, in your case, there must be 20 samples, not 5.
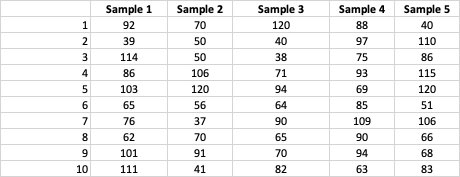
Sample 1 Sample 2 Sample 3 Sample 4 Sample 5 H 92 70 120 88 40 2 39 50 40 97 110 3 114 50 38 75 86 A 86 106 71 93 115 un 103 120 94 69 120 6 65 56 64 85 51 7 76 37 90 109 106 8 62 70 65 90 66 6 101 91 70 94 68 10 111 41 82 63 83
Step by Step Solution
There are 3 Steps involved in it
1 Expert Approved Answer
Step: 1 Unlock

Question Has Been Solved by an Expert!
Get step-by-step solutions from verified subject matter experts
Step: 2 Unlock
Step: 3 Unlock