

Question: In this assignment you will use the Balance Sheet and Income Statement to compare the financial position of two firms. Use the given financial statements
In this assignment you will use the Balance Sheet and Income Statement to compare the financial position of two firms. Use the given financial statements to complete the financial ratio analysis on page 3 (required answers highlighted in yellow). The answers for Coca-Cola Company are given; you just need to complete the ratios for Pepsico, Inc
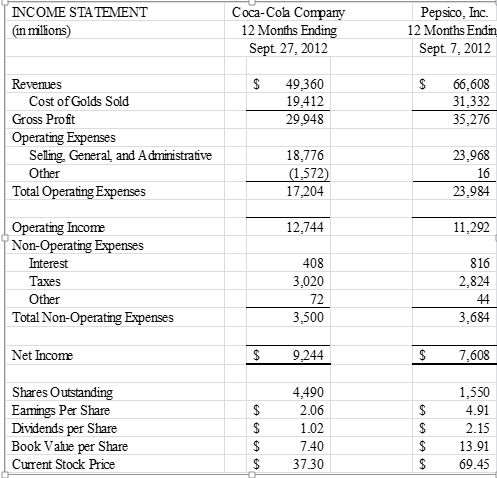
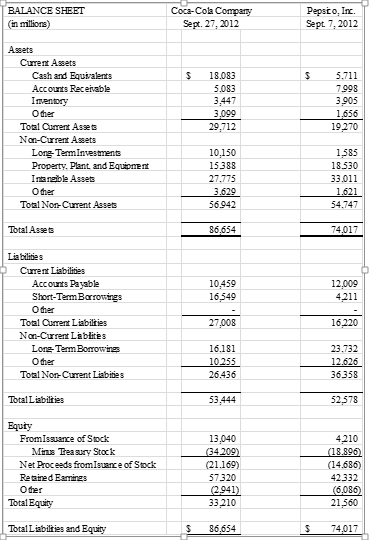
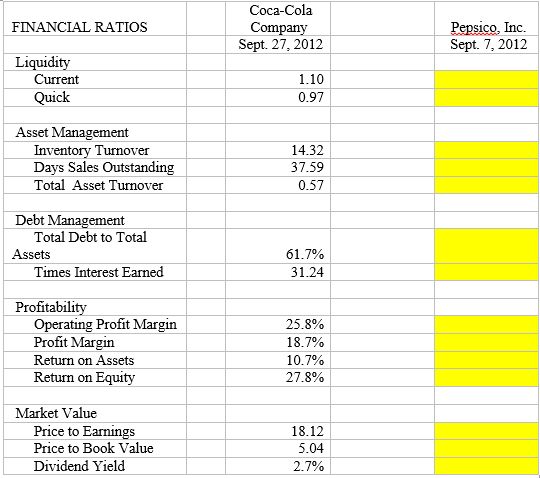
INCOME STATEMENT (in millions) Coca-Cola Company 12 Months Ending Sept 27, 2012 Pepsico, Inc. 12 Months Endin Sept 7, 2012 $ $ Reveries Cost of Golds Sold Gross Profit Operating Expenses Selling, General and Administrative 49,360 19,412 29,948 66,608 31,332 35,276 Other 18,776 (1,572) 17,204 23,968 16 23,984 Total Operating Expenses 12,744 11,292 Operating Income Non-Operating Expenses Interest Taxes Other Total Non-Operating Expenses 408 3,020 72 3,500 816 2,824 44 3,684 Net Income $ 9,244 $ 7,608 Shares Outstanding Eatings Per Share Dividends per Share Book Vale per Share Curent Stock Price 4,490 2.06 1.02 $ $ $ $ A A A A 1,550 4.91 2.15 13.91 69.45 7.40 37.30 BALANCE SHEET (in million) Coca-Cola Company Sept. 27, 2012 Pepsco, Inc. Sept. 7. 2012 $ $ Assets Current Assets Cash and Equivalents Accounts Receivable Inventory Other Total Current Assets Non-Current Assets Long-Term Investments Property. Plant and Equipment Intangible Assets Other Total Non-Current Assets 18.083 5.083 3.447 3,099 29,712 5.711 7998 3.905 1,656 19270 10.150 15388 27.775 3.629 56.942 1.585 18.530 33.011 1.621 54.747 Total Assets 86.654 74.017 10,459 16,549 12.009 4,211 Liabilities Current Liabilities Accounts Payable Short-Term Barrowings Other Total Current Liabilties Non-Current La blites Long Term Borrowing Other Total Non-Current Liabities 27,008 16.220 16.181 10.255 26.436 23.732 12.626 36.358 Total Liabilties 53.444 52,578 Equty From Issuance of Stock Minus Treasury Stock Net Proceeds from Isuance of Stock Retained Earnings Other Total Equity 13.040 (34209) (21.169) 57320 (2.941) 33.210 4,210 (18.896) (14.686) 42.332 (6,086 21,560 Total Liabilties and Equity 86,654 $ 74.017 FINANCIAL RATIOS Coca-Cola Company Sept. 27, 2012 Pepsico, Inc. Sept. 7, 2012 Liquidity Current Quick 1.10 0.97 Asset Management Inventory Turnover Days Sales Outstanding Total Asset Turnover 14.32 37.59 0.57 Debt Management Total Debt to Total Assets Times Interest Earned 61.7% 31.24 Profitability Operating Profit Margin Profit Margin Return on Assets Return on Equity 25.8% 18.7% 10.7% 27.8% Market Value Price to Earnings Price to Book Value Dividend Yield 18.12 5.04 2.7%
Step by Step Solution
There are 3 Steps involved in it

Get step-by-step solutions from verified subject matter experts