Question: In this assignment, you will use the provided template to create an Excel spreadsheet with data calculations and a Microsoft Word document detailing your findings.
In this assignment, you will use the provided template to create an Excel spreadsheet with data calculations and a Microsoft Word document detailing your findings. Review the Mergent Online Guide included in the Resources section of Module One.
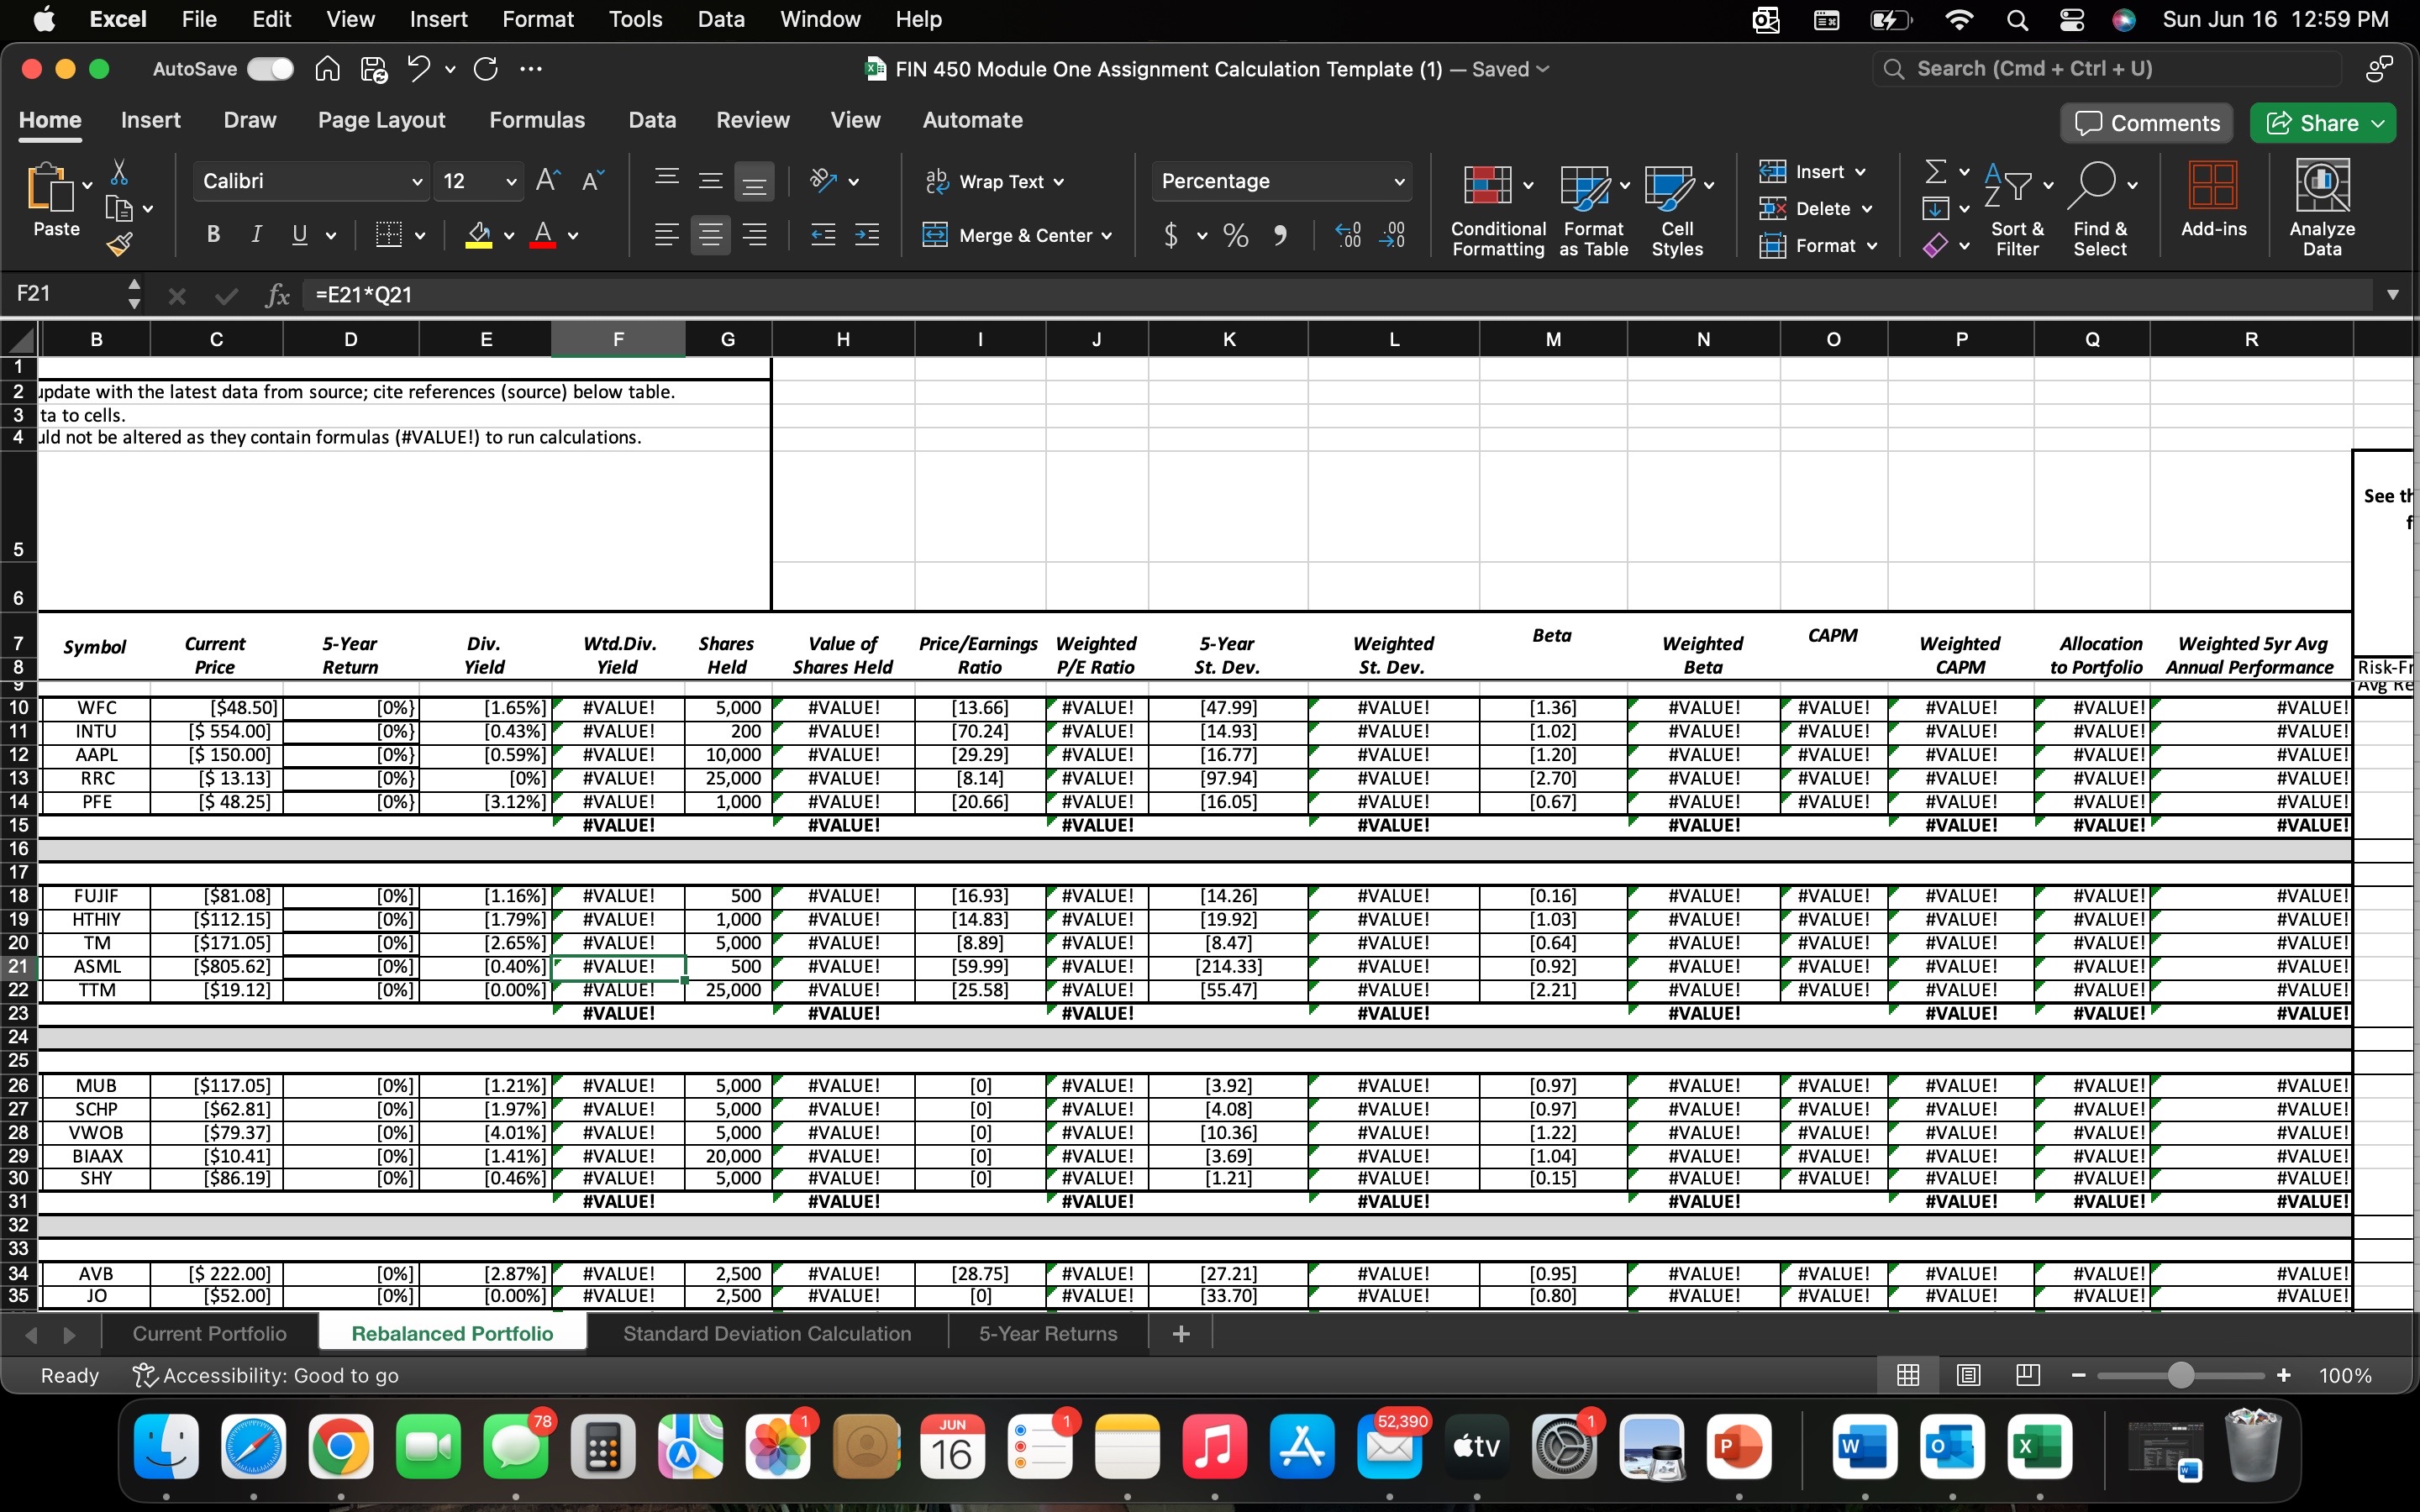
First, examine the Module One Assignment Calculation Template provided in the Supporting Materials section. Use the search tool in Mergent Online, located in the module resources, to research five company stocks (U.S. Equity, International Equity, or a combination of both) within the portfolio's holdings (the Current Portfolio tab). Once you find your company in the list and click on it, select the far-right tab, called Company Reports, and choose Equity Reports to access a PDF file overview of the company's financial performance. You should also review other tabs, such as Company Financials and Equity Pricing, to learn more about the company's financial position.
Once you have gathered information on each company, explain your findings in a Microsoft Word document and show your work in the Module One Assignment Calculation Template. You will enter your work into the equity section of the Current Portfolio spreadsheet and 5-Year Returns spreadsheet. Only five company stocks need to be completed in the template for this assignment; you will complete more of the template in future modules. Note that weighted fields will have #VALUE! results until you complete the portfolio later in the course.
Specifically, you must address the following rubric criteria:
For each of the five company stocks you choose, identify positive and negative factors within the portfolio. Consider the following in your identification:
Which factors determine the stock's valuation?
What data points indicate the direction of the stock price?
Describe how each stock is rated compared to its peers and the valuation method(s) used to determine this rating. Discuss the following data points for each investment:
Equity valuation ratios, such as the price to earnings (P/E) ratio
52-week price changes
Moving average
Earnings
Risk ratios
Explain additional considerations used for valuation from your investigation of the financials for each investment.
Excel File Edit View Insert Format Tools Data Window Help Q @ Sun Jun 16 12:59 PM AutoSave FIN 450 Module One Assignment Calculation Template (1) - Saved Q Search (Cmd + Ctri + U) Home Insert Draw Page Layout Formulas Data Review View Automate Comments Share Calibri 12 AA B Wrap Text v Percentage Insert v Paste Delete BIUv A Merge & Center v v % " Conditional Format Cell Sort & Format v Find & Add-ins Analyze Formatting as Table Styles Filter Select Data F21 X V fx =E21*Q21 B C D E F G H K L M N O P Q R update with the latest data from source; cite references (source) below table. 3 ta to cells. uld not be altered as they contain formulas (#VALUE!) to run calculations. See th 5 6 Symbol Current 5-Yea Div. Wtd.Div. Shares Value of Price/Earnings Weighted 5-Year Weighted Beta Weighted CAPM Weighted Allocation Price Return Yield Weighted 5yr Avg Yield Held Shares Held Ratio P/E Ratio St. Dev. St. Dev. Beta APM to Portfolio Annual Performance Risk-F WFC [$48.50] [0%} [1.65%] #VALUE 5,000 #VALUE Avg KE 13.66] #VALUE! 47.99] #VALUE [1.36] #VALUE $ 554.00] [0%} #VALUE! #VALUE INTU #VALUE 0.43%] #VALUE! #VALUE! 200 #VALUE [70.24 #VALUE! [14.93 #VALUE [1.02] VALUE AAPL #VALUE! #VALUE ($ 150.00] [0% #VALUE! 0.59% #VALUE! #VALUE! 10,000 VALUE! 13 [29.29 #VALUE! [16.77 #VALUE [1.20] #VALUE #VALUE! #VALUE RR [$ 13.13] [0%) #VALUE! #VALUE! [0%] #VALUE! 25,000 #VALUE 14 [8.14] #VALUE! 97.94 #VALUE! [2.70] #VALUE PFF [$ 48.25] #VALUE! #VALUE [3.12%] #VALUE! #VALUE! #VALUE! 1,000 #VALUE! 15 [20.66 #VALUE! [16.05] #VALUE [0.67] #VALUE #VALUE! #VALUE VALUE! #VALUE! #VALUE! #VALUE #VALUE #VALUE! 16 #VALUE #VALUE #VALUE! #VALUE! 17 18 FUJIF [$81.08] [0%] 1.16%] #VALUE! 500 #VALUE! 16.93] 19 #VALUE! 14.26] #VALUE! [0.16] #VALUE! HTHIY [0% #VALUE! #VALUE! $112.15] #VALUE! 1.79%] #VALUE #VALUE! 1,000 #VALUE! 20 14.83] #VALUE! [19.92] #VALUE! [1.03] VALUE! TM $171.05] [0% #VALUE! #VALUE #VALUE! 2.65%] #VALUE #VALUE 5,000 #VALUE! 3.891 #VALUE! 8.47] #VALUE! 0.64] #VALUE ASML $805.62] 0.40%] #VALUE! #VALUE #VALUE! #VALUE! #VALUE 500 #VALUE! 59.99] #VALUE! 214.3 #VALUE! 0.92] TTM VALUE! 0%1 #VALUE! #VALUE $19.12] #VALUE! 0.00%] #VALUE! #VALUE! 25,000 #VALUE! 25.58 #VALUE! [55.47] #VALUE! 2.21 #VALUE! #VALUE! #VALUE #VALUE! #VALUE #VALUE! #VALUE! #VALUE! #VALUE! #VALUE! #VALUE #VALUE! #VALUE! MUB [$117.05] [0%] [1.21%] #VALUE! 5,000 #VALUE! #VALUE! [3.92] #VALUE! #VALUE! SCHP [0.97] #VALUE! #VALUE $62.81] [0%] #VALUE! 1.97%] #VALUE! #VALUE! 5,000 #VALUE #VALUE! [4.08] #VALUE! [0.97] #VALUE VWOB ($79.37] [0%] #VALUE! #VALUE #VALUE! #VALUE! (4.01%] #VALUE 5,000 #VALUE 29 #VALUE! 10.361 #VALUE [1.22] #VALUE! BIAAX #VALUE! #VALUE #VALUE! [$10.41] [0% ] #VALUE 1.41%] #VALUE! 20,000 #VALUE #VALUE! 3.69] #VALUE! [1.04] 30 SHY #VALUE #VALUE! $86.19] #VALUE! #VALUE! 0.46%] #VALUE! #VALUE 5,000 #VALUE #VALUE! [1.21 #VALUE 0.151 #VALUE #VALUE! #VALUE #VALUE! #VALUE #VALUE #VALUE! #VALUE! #VALUE! #VALUE! #VALUE! #VALUE! #VALUE! 34 AVB $ 222.00] 0%]/ 2.87%] #VALUE! 35 2,500 #VALUE! [28.75] #VALUE! 27.21 #VALUE! JO [0.95] #VALUE! $52.00] 0%1 #VALUE! #VALUE! #VALUE! 0.00%] #VALUE #VALUE! 2,500 #VALUE! 01 #VALUE! [33.70] #VALUE! 0.80] #VALUE! #VALUE! #VALUE! #VALUE! #VALUE Current Portfolio Rebalanced Portfolio Standard Deviation Calculation 6-Year Returns Ready Accessibility: Good to go 100% 30 0 78 JUN 52,390 16 4 astv
Step by Step Solution
There are 3 Steps involved in it
1 Expert Approved Answer
Step: 1 Unlock
Question Has Been Solved by an Expert!
Get step-by-step solutions from verified subject matter experts
Step: 2 Unlock
Step: 3 Unlock
Students Have Also Explored These Related Finance Questions!