Question: In this draft. teams are expected to submit a preview ofthe final version; it must cover all points A-C below. Please referto the Main you
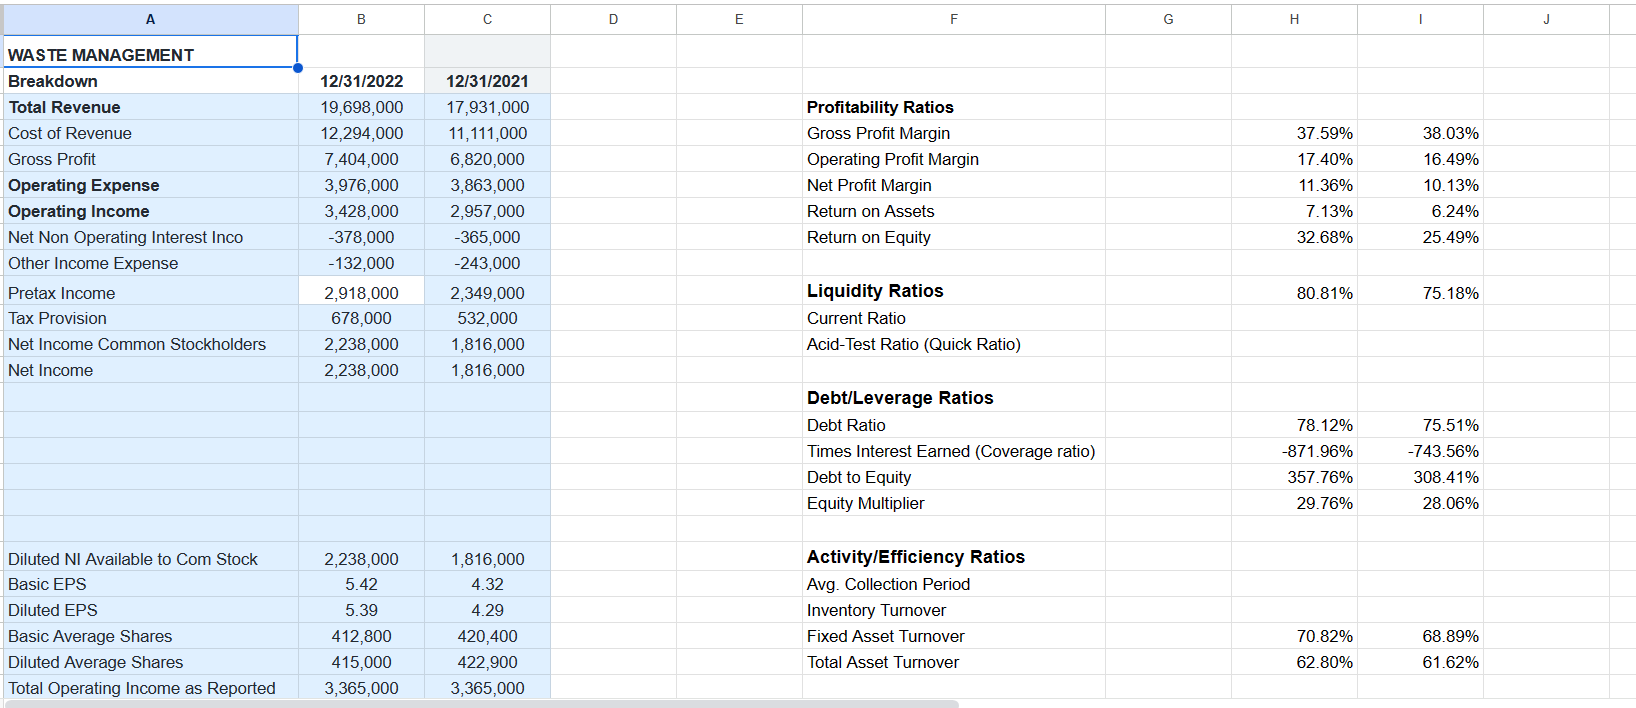
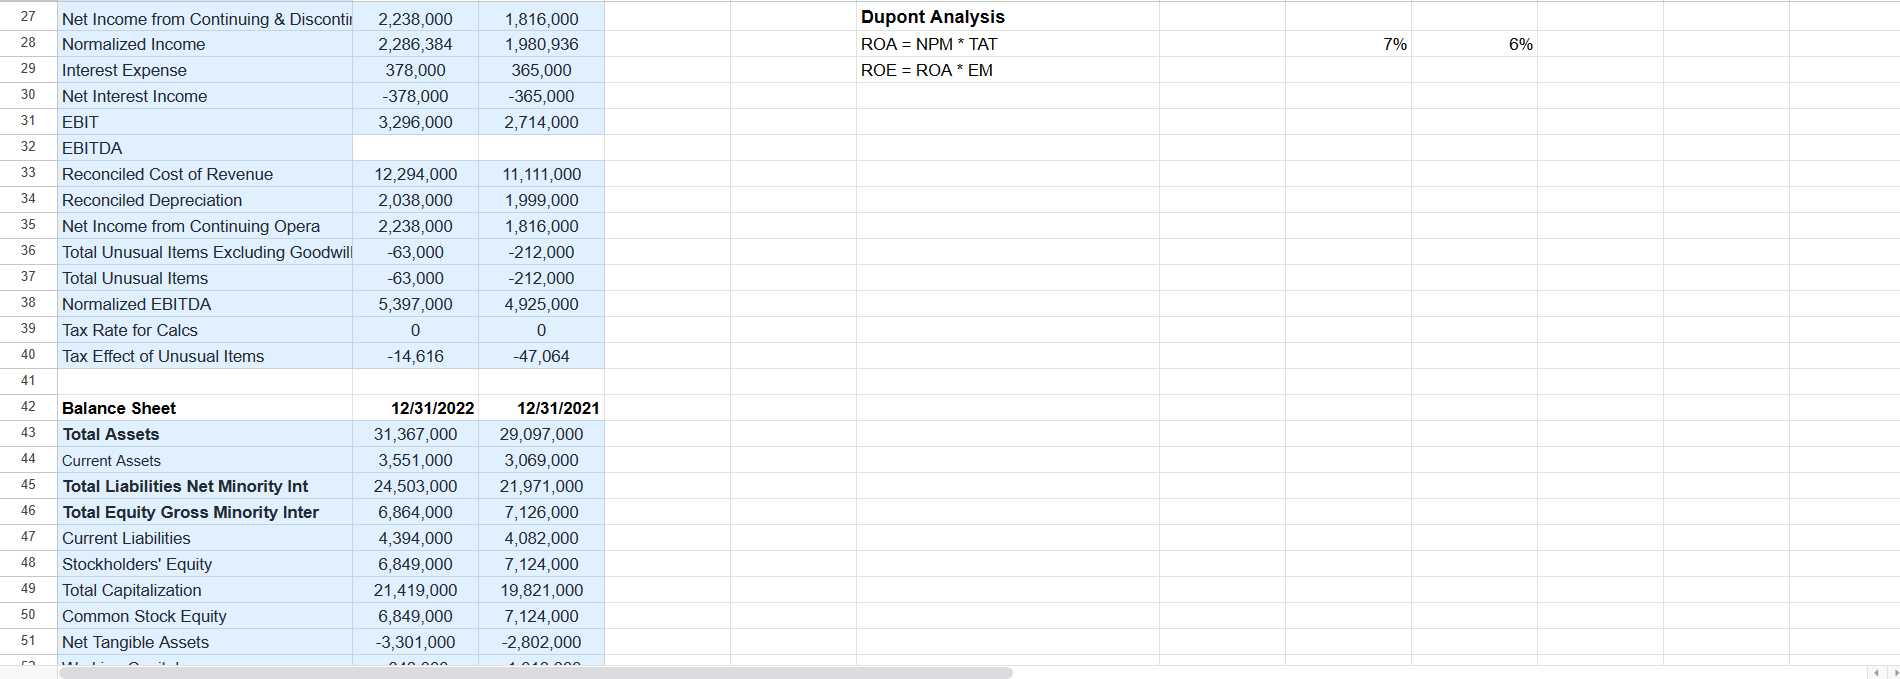
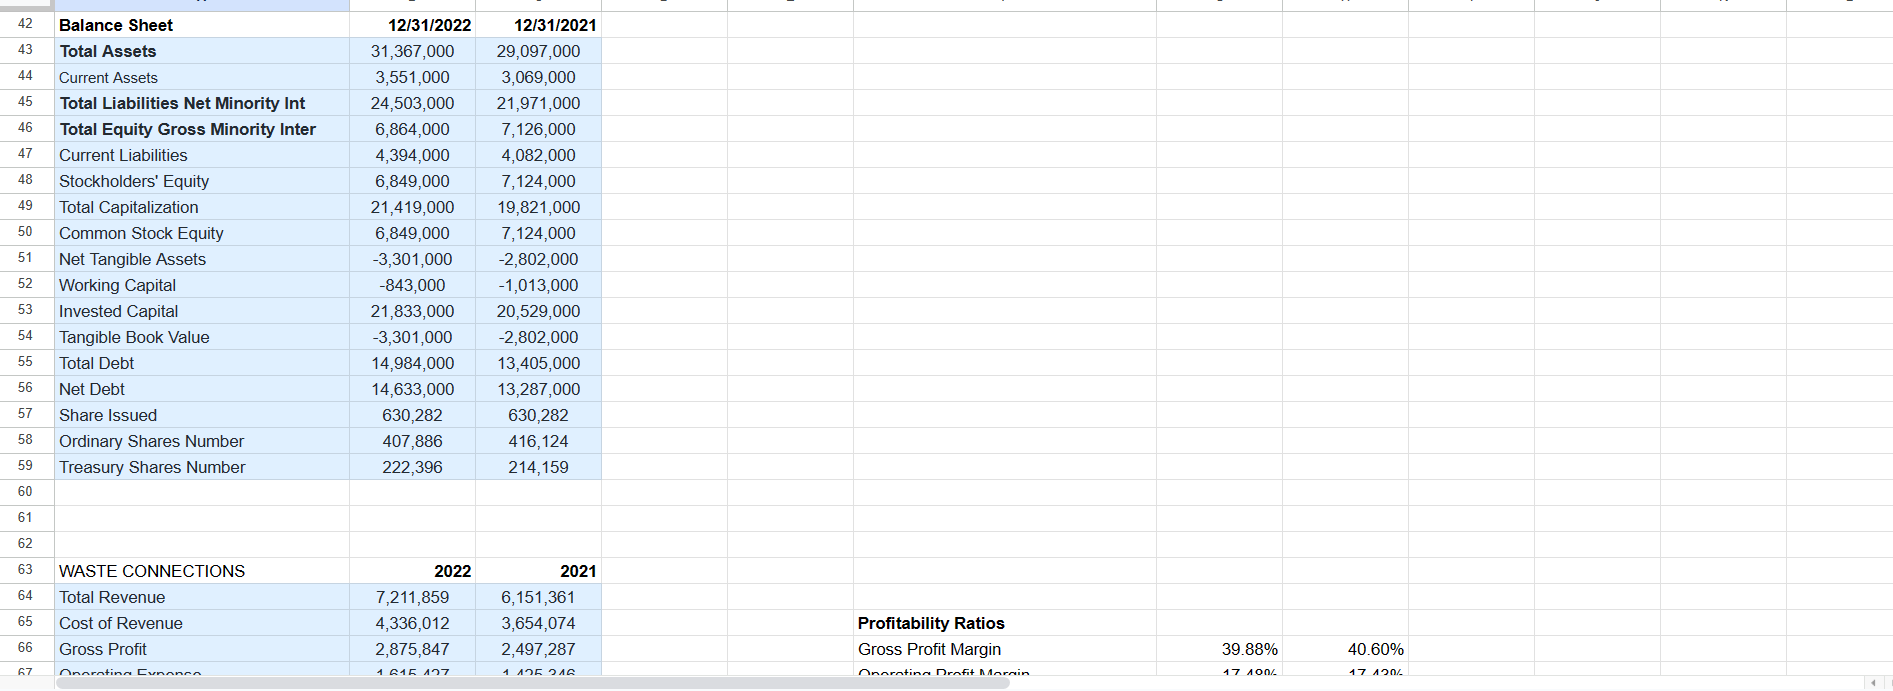
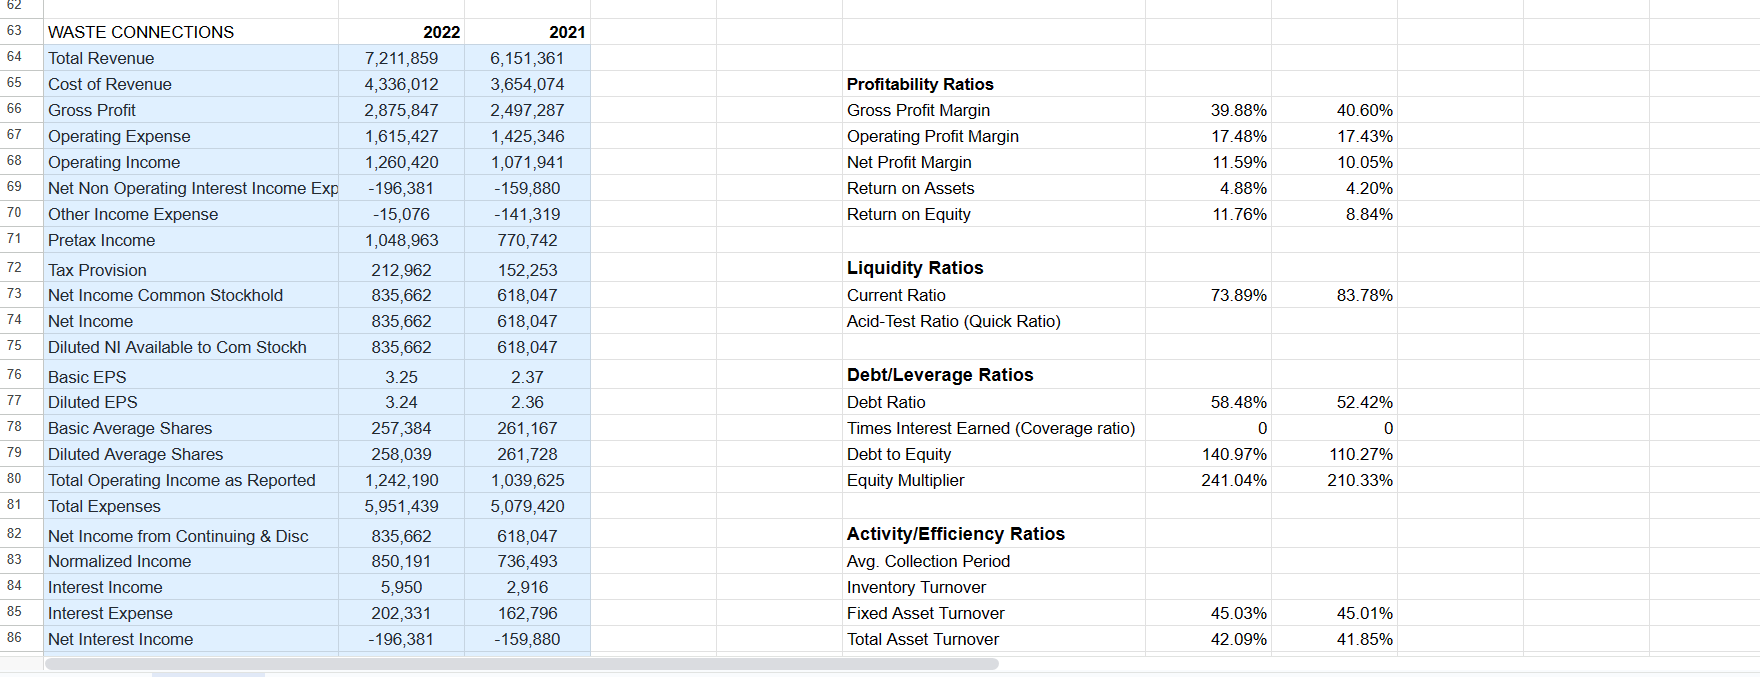
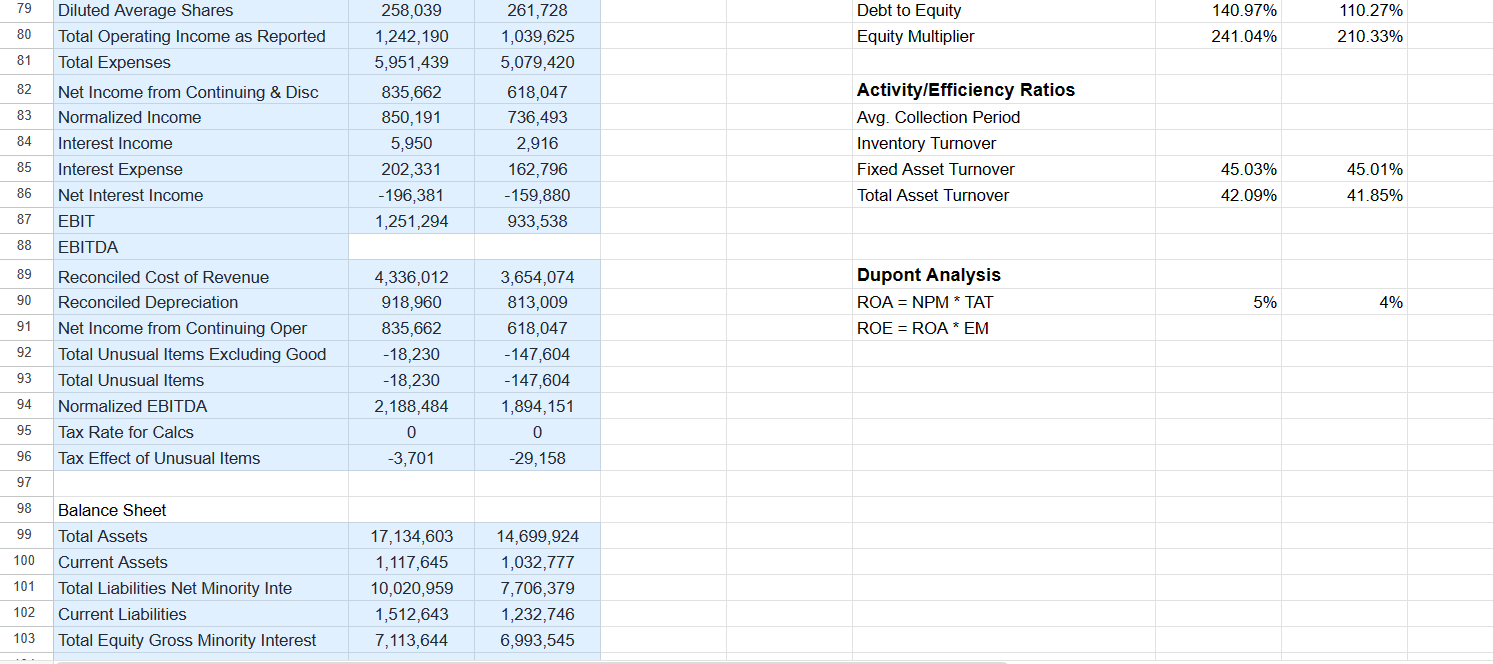
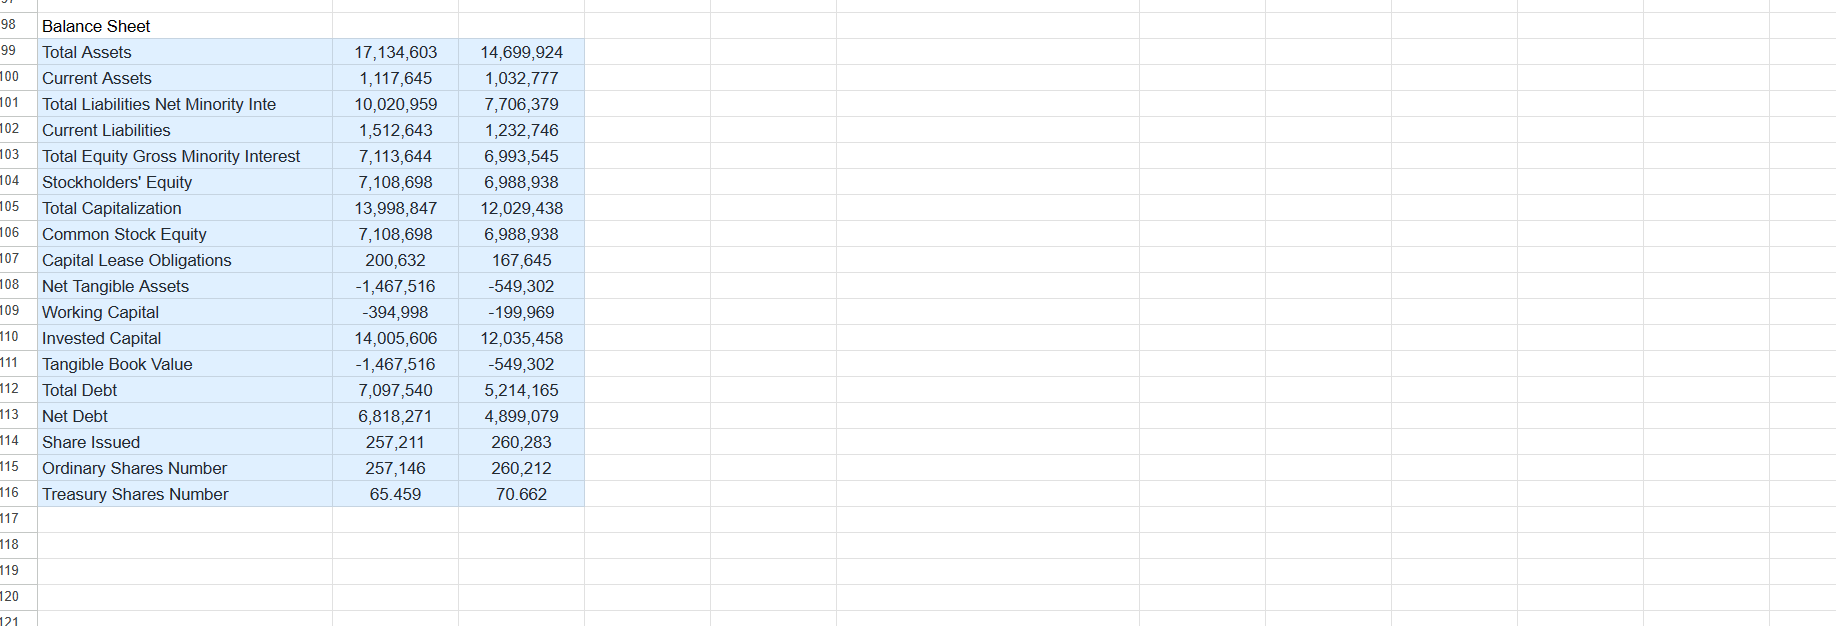
In this draft. teams are expected to submit a preview ofthe final version; it must cover all points A-C below. Please referto the Main you complete all the points so that I can provide feedback and guide you better to the final version of the project. I expect to meet with each team to go overthe draft and how to improve it in the final version. The draft is worth 10% of the overall project grade so it is very important that you submit it on time. It does not have to be perfect but it should attempt to cover all the points listed described in the main page ofthe \"Final Project Report\" (in Modules). Overview. The goal of this team assignment is to evaluate the nancial conditions and investment opportunities (using one capital investment) of a small or medium size business. The main outcomes are: A) Financial statements (Balance sheet and Income Statement) and the results from your Financial statement analysis. In addition this must show your calculations ofthe Cost of capital and the data and results from Capital budgeting techniques. (Reported in Excel). B) Your analysis and discussion of the business' current nancial conditions based on the financial statement analysis, cost of capital and capital budgeting results. Provide a background ofthe business. The analysis must be reported in a Word document using APA format: cite any references used. including the textbook. C)A recommendation to the firm so they can improve both profitability measures and shareholders' wealth. This must be based on your analysis in excel above. These recommendations must be presented after the Analysis of the nancial conditions. in fact, your recommendation is based on the discussion from B. and must follow the analysis and discussion described in point B. Use the same word document and APA format. Before you start analyzing the firm, make sure we meet to discuss the business you plan to examine. Teams must get the professor's approval for the business that will be examined. Only one Canvas submission per team is required. Since there will be calculations in Excel and a written report in Word, teams must submit two les (one Excel and one Word file). No other formats or le extensions are allowed. A B C D E F G H WASTE MANAGEMENT Breakdown 12/31/2022 12/31/2021 Total Revenue 19,698,000 17,931,000 Profitability Ratios Cost of Revenue 12,294,000 11, 111,000 Gross Profit Margin 37.59% 38.03% Gross Profit 7,404,000 6,820,000 Operating Profit Margin 17.40% 16.49% Operating Expense 3,976,000 3,863,000 Net Profit Margin 11.36% 10.13% Operating Income 3,428,000 2,957,000 Return on Assets 7.13% 6.24% Net Non Operating Interest Inco -378,000 -365,000 Return on Equity 32.68% 25.49% Other Income Expense -132,000 -243,000 Pretax Income 2,918,000 2,349,000 Liquidity Ratios 80.81% 75.18% Tax Provision 678,000 532,000 Current Ratio Net Income Common Stockholders 2,238,000 1,816,000 Acid-Test Ratio (Quick Ratio) Net Income 2,238,000 1,816,000 Debt/Leverage Ratios Debt Ratio 78.12% 75.51% Times Interest Earned (Coverage ratio) 871.96% -743.56% Debt to Equity 357.76% 308.41% Equity Multiplier 29.76% 28.06% Diluted NI Available to Com Stock 2,238,000 1,816,000 Activity/Efficiency Ratios Basic EPS 5.42 4.32 Avg. Collection Period Diluted EPS 5.39 4.29 Inventory Turnover Basic Average Shares 412,800 420,400 Fixed Asset Turnover 70.82% 68.89% Diluted Average Shares 415,000 422,900 Total Asset Turnover 62.80% 61.62% Total Operating Income as Reported 3,365,000 3,365,00027 Net Income from Continuing & Disconti 2,238,000 1,816,000 Dupont Analysis 28 Normalized Income 2,286,384 1,980,936 ROA = NPM * TAT 7% 6% 29 Interest Expense 378,000 365,000 ROE = ROA * EM 30 Net Interest Income -378,000 365,000 31 EBIT 3,296,000 2,714,000 32 EBITDA 33 Reconciled Cost of Revenue 12,294,000 11, 111,000 34 Reconciled Depreciation 2,038,000 1,999,000 35 Net Income from Continuing Opera 2,238,000 1,816,000 36 Total Unusual Items Excluding Goodwill -63,000 -212,000 37 Total Unusual Items 63,000 -212,000 38 Normalized EBITDA 5,397,000 4,925,000 39 Tax Rate for Calcs 0 40 Tax Effect of Unusual Items -14,616 47,064 41 42 Balance Sheet 12/31/2022 12/31/2021 43 Total Assets 31,367,000 29,097,000 44 Current Assets 3,551,000 3,069,000 45 Total Liabilities Net Minority Int 24,503,000 21,971,000 46 Total Equity Gross Minority Inter 6,864,000 7, 126,000 47 Current Liabilities 4,394,000 4,082,000 48 Stockholders' Equity 6,849,000 7, 124,000 49 Total Capitalization 21,419,000 19,821,000 50 Common Stock Equity 6,849,000 7, 124,000 51 Net Tangible Assets -3,301,000 -2,802,000 nin non42 43 44 45 46 47 48 49 50 51 52 53 54 55 56 57 58 59 so 51 52 53 54 55 68 n7 Balance Sheet Total Assets Current Assets Total Liabilities Net Minority Int Total Equity Gross Minority Inter Current Liabilities Stockholders' Equity Total Capitalization Common Stock Equity Net Tangible Assets Working Capital Invested Capital Tangible Book Value Total Debt Net Debt Snare Issued Ordinary Shares Number Treasury Shares Number WASTE CONNECTIONS Total Revenue Cost of Revenue Gross Prot 125172022 31,367,000 3,551,000 24,503,000 6,864,000 4,394,000 6,849,000 21 419,000 6,849,000 73,301,000 843,000 21,833,000 73,301,000 14,984,000 14,633,000 630,282 407,886 222,396 2022 7,211,859 4,336,012 2,875,847 1 mi: d'17 127302021 29,097,000 3,069,000 21 971,000 7,126,000 4,082,000 7,124,000 19,821,000 7,124,000 72,302,000 1 ,013,000 20,529,000 72,802,000 13,405,000 13,287,000 630,282 416,124 214,159 2021 6,151,361 3,654,074 2,497,287 1 4m: '74:: Protability Ratios Gross Prot Margin nhnmm... nmm n ammo. 39 88% 47mm. 40 60% 47mm. 63 WASTE CONNECTIONS 2022 2021 64 Total Revenue 7,211,859 6, 151,361 65 Cost of Revenue 4,336,012 3,654,074 Profitability Ratios 66 Gross Profit 2,875,847 2,497,287 Gross Profit Margin 39.88% 40.60% 67 Operating Expense 1,615,427 1,425,346 Operating Profit Margin 17.48% 17.43% 68 Operating Income 1,260,420 1,071,941 Net Profit Margin 11.59% 10.05% 69 Net Non Operating Interest Income Exp -196,381 -159,880 Return on Assets 4.88% 4.20% 70 Other Income Expense -15,076 -141,319 Return on Equity 11.76% 8.84% 71 Pretax Income 1,048,963 770,742 72 Tax Provision 212,962 152,253 Liquidity Ratios 73 Net Income Common Stockhold 835,662 618,047 Current Ratio 73.89% 83.78% 74 Net Income 835,662 618,047 Acid-Test Ratio (Quick Ratio) 75 Diluted NI Available to Com Stockh 835,662 618,047 76 Basic EPS 3.25 2.37 Debt/Leverage Ratios 77 Diluted EPS 3.24 2.36 Debt Ratio 58.48% 52.42% 78 Basic Average Shares 257,384 261,167 Times Interest Earned (Coverage ratio) 0 0 79 Diluted Average Shares 258,039 261,728 Debt to Equity 140.97% 110.27% 80 Total Operating Income as Reported 1,242, 190 1,039,625 Equity Multiplier 241.04% 210.33% 81 Total Expenses 5,951,439 5,079,420 82 Net Income from Continuing & Disc 835,662 618,047 Activity/Efficiency Ratios 83 Normalized Income 850, 191 736,493 Avg. Collection Period 84 Interest Income 5,950 2,916 Inventory Turnover 85 Interest Expense 202,331 162,796 Fixed Asset Turnover 45.03% 45.01% 86 Net Interest Income -196,381 -159,880 Total Asset Turnover 42.09% 41.85%79 Diluted Average Shares 258,039 261,728 Debt to Equity 140.97% 110.27% 80 Total Operating Income as Reported 1,242, 190 1,039,625 Equity Multiplier 241.04% 210.33% 81 Total Expenses 5,951,439 5,079,420 82 Net Income from Continuing & Disc 835,662 618,047 Activity/Efficiency Ratios 83 Normalized Income 850, 191 736,493 Avg. Collection Period 84 Interest Income 5,950 2,916 Inventory Turnover 85 Interest Expense 202,331 162,796 Fixed Asset Turnover 45.03% 45.01% 86 Net Interest Income -196,381 -159,880 Total Asset Turnover 42.09% 41.85% 87 EBIT 1,251,294 933,538 88 EBITDA 89 Reconciled Cost of Revenue 4,336,012 3,654,074 Dupont Analysis 90 Reconciled Depreciation 918,960 813,009 ROA = NPM * TAT 5% 4% 91 Net Income from Continuing Oper 835,662 618,047 ROE = ROA * EM 92 Total Unusual Items Excluding Good -18,230 -147,604 93 Total Unusual Items -18,230 -147,604 94 Normalized EBITDA 2, 188,484 1,894, 151 95 Tax Rate for Calcs 0 0 96 Tax Effect of Unusual Items -3,701 29, 158 97 98 Balance Sheet 99 Total Assets 17, 134,603 14,699,924 100 Current Assets 1, 117,645 1,032,777 101 Total Liabilities Net Minority Inte 10,020,959 7,706,379 102 Current Liabilities 1,512,643 1,232,746 103 Total Equity Gross Minority Interest 7, 113,644 6,993,54598 Balance Sheet 99 Total Assets 17, 134,603 14,699,924 00 Current Assets 1, 117,645 1,032,777 01 Total Liabilities Net Minority Inte 10,020,959 7,706,379 02 Current Liabilities 1,512,643 1,232,746 03 Total Equity Gross Minority Interest 7, 113,644 6,993,545 04 Stockholders' Equity 7, 108,698 6,988,938 05 Total Capitalization 13,998,847 12,029,438 06 Common Stock Equity 7, 108,698 6,988,938 07 Capital Lease Obligations 200,632 167,645 08 Net Tangible Assets -1,467,516 -549,302 09 Working Capital -394,998 -199,969 10 Invested Capital 14,005,606 12,035,458 11 Tangible Book Value -1,467,516 -549,302 12 Total Debt 7,097,540 5,214, 165 13 Net Debt 6,818,271 4,899,079 14 Share Issued 257,211 260,283 15 Ordinary Shares Number 257, 146 260,212 16 Treasury Shares Number 65.459 70.662 17 18 19 20
Step by Step Solution
There are 3 Steps involved in it
1 Expert Approved Answer
Step: 1 Unlock
Question Has Been Solved by an Expert!
Get step-by-step solutions from verified subject matter experts
Step: 2 Unlock
Step: 3 Unlock
Students Have Also Explored These Related Finance Questions!