

In this exercise, we study how effective various government policies designed to discourage drunk driving actually are
Question:
In this exercise, we study how effective various government policies designed to discourage drunk driving actually are in reducing traffic deaths. The panel data set contains variables related to traffic fatalities and alcohol, including the number of traffic fatalities in each state in each year, the type of drunk driving laws in each state in each year, and the tax on beer in each state. The measure of traffic deaths we use is the fatality rate, which is the number of annual traffic deaths per 10,000 people in the population in the state. The measure of alcohol taxes we use is the “real” tax on a case of beer, which is the beer tax, put into 1988 dollars by adjusting for inflation.
The panel data set also includes information regarding the minimum legal drinking age, represented by three binary variables for a minimum legal drinking age of 18, 19, and 20 (so the omitted group is a minimum legal drinking age of 21 or older). The three measures of driving and economic conditions are average vehicle miles per driver, the unemployment rate, and the logarithm of real (1988 dollars) personal income per capita (using the logarithm of income permits the coefficient to be interpreted in terms of percentage changes of income).
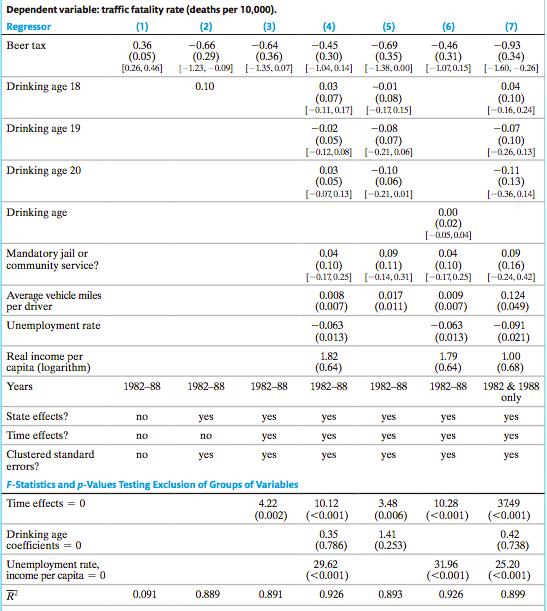
New Jersey has a population of 8.85 million people. Suppose New Jersey increases the tax on a case of beer by $2 (in 1988 dollars).
Use the results in column (5) to predict the change in the number of traffic fatalities over the next year. (Report your answer to the nearest whole number, in terms of deaths, not deaths per 10,000. If traffic fatalities decrease, include a negative sign)
Construct a 99% confidence interval for the predicted change in the number of traffic fatalities.
The lower bound is: (Report your answer to the nearest whole number, in terms of deaths, not deaths per 10,000. If traffic fatalities decrease, include a negative sign)
The upper bound is: (Report your answer to the nearest whole number, in terms of deaths, not deaths per 10,000. If traffic fatalities decrease, include a negative sign)
Expert Answer:
a The coefficient for a 2 increase in tax is 069 with a standard error of 035 Since New Jersey has a ... View the full answer


Probability and Statistics
ISBN: 978-0321500465
4th edition
Authors: Morris H. DeGroot, Mark J. Schervish
