

Question: In this exercise, you will learn what is involved in determining the interpolation polynomial numerically, how this polynomial is stored, and how it is evaluated.
In this exercise, you will learn what is involved in determining the interpolation polynomial numerically, how this polynomial is stored, and how it is evaluated.
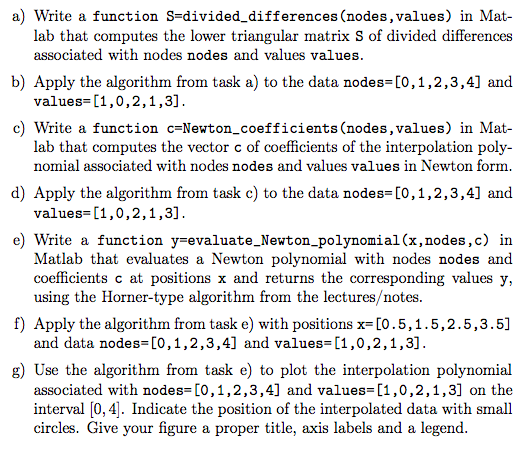
a) Write a function S-divided_differences (nodes,values) in Mat- lab that computes the lower triangular matrix S of divided differences associated with nodes nodes and values values b) Apply the algorithm from task a) to the data nodes-[0,1,2,3,4] and values-[1,0,2,1,3] c) Write a function c-Newton_coefficients (nodes,values) in Mat- lab that computes the vector c of coefficients of the interpolation poly- nomial associated with nodes nodes and values values in Newton form. d) Apply the algorithm from task c) to the data nodes-[0,1,2,3,4] and values-[1,0,2,1,3] e) Write a function y-evaluate_Newton_polynomial (x,nodes,c) in Matlab that evaluates a Newton polynomial with nodes nodes and coefficients c at positions x and returns the corresponding values y, using the Horner-type algorithm from the lecturesotes. Apply the algorithm from task e) with positions x= [05, 15, 2 . 5 3.5] and data nodes-[0,1,2,3,4] and values-[1,0,2,1,3] f) g) Use the algorithm from task e) to plot the interpolation polynomial associated with nodes-[0,1,2,3,4] and values [1,0,2,1,3] on the interval [0, 4]. Indicate the position of the interpolated data with small circles. Give your figure a proper title, axis labels and a legend a) Write a function S-divided_differences (nodes,values) in Mat- lab that computes the lower triangular matrix S of divided differences associated with nodes nodes and values values b) Apply the algorithm from task a) to the data nodes-[0,1,2,3,4] and values-[1,0,2,1,3] c) Write a function c-Newton_coefficients (nodes,values) in Mat- lab that computes the vector c of coefficients of the interpolation poly- nomial associated with nodes nodes and values values in Newton form. d) Apply the algorithm from task c) to the data nodes-[0,1,2,3,4] and values-[1,0,2,1,3] e) Write a function y-evaluate_Newton_polynomial (x,nodes,c) in Matlab that evaluates a Newton polynomial with nodes nodes and coefficients c at positions x and returns the corresponding values y, using the Horner-type algorithm from the lecturesotes. Apply the algorithm from task e) with positions x= [05, 15, 2 . 5 3.5] and data nodes-[0,1,2,3,4] and values-[1,0,2,1,3] f) g) Use the algorithm from task e) to plot the interpolation polynomial associated with nodes-[0,1,2,3,4] and values [1,0,2,1,3] on the interval [0, 4]. Indicate the position of the interpolated data with small circles. Give your figure a proper title, axis labels and a legend
Step by Step Solution
There are 3 Steps involved in it

Get step-by-step solutions from verified subject matter experts