

Question: In this lab activity, we will use Microsoft Excel to find summary statistics for a data set and to construct boxplets. Complete each of
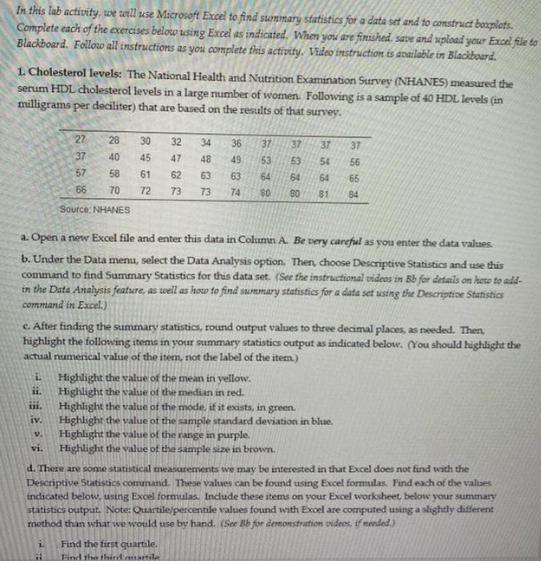
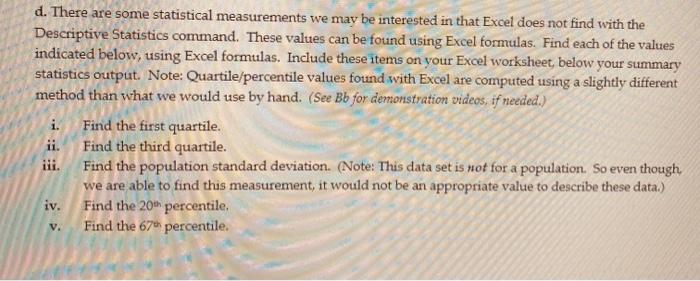
In this lab activity, we will use Microsoft Excel to find summary statistics for a data set and to construct boxplets. Complete each of the exercises below using Excel as indicated. When you are finished, save and upload your Excel file to Blackboard. Follow all instructions as you complete this activity. Video instruction is available in Blackboard. 1. Cholesterol levels: The National Health and Nutrition Examination Survey (NHANES) measured the serum HDL cholesterol levels in a large number of women. Following is a sample of 40 HDL levels (in milligrams per deciliter) that are based on the results of that survey. 27 28 30 32 34 36 37 40 45 47 48 49 57 58 61 62 63 63 66 70 72 73 73 74 5238 37 37 37 53 54 56 64 64 64 65 80 81 84 Source: NHANES a. Open a new Excel file and enter this data in Column A. Be very careful as you enter the data values. b. Under the Data menu, select the Data Analysis option. Then, choose Descriptive Statistics and use this command to find Summary Statistics for this data set. (See the instructional videos in Bb for details on here to add- in the Data Analysis feature, as well as how to find summary statistics for a data set using the Descriptive Statistics command in Excel.) c. After finding the summary statistics, round output values to three decimal places, as needed. Then, highlight the following items in your summary statistics output as indicated below. (You should highlight the actual numerical value of the item, not the label of the item) L Highlight the value of the mean in yellow. ii. Highlight the value of the median in red. 111. Highlight the value of the mode, if it exists, in green. iv. Highlight the value of the sample standard deviation in blue. v. Highlight the value of the range in purple. vi. Highlight the value of the sample size in brown. d. There are some statistical measurements we may be interested in that Excel does not find with the Descriptive Statistics command. These values can be found using Excel formulas. Find each of the values indicated below, using Excel formulas. Include these items on your Excel worksheet, below your summary statistics output. Note: Quartile/percentile values found with Excel are computed using a slightly different method than what we would use by hand. (See Bb for demonstration videos, if mended) Find the first quartile. Find the thiril martile d. There are some statistical measurements we may be interested in that Excel does not find with the Descriptive Statistics command. These values can be found using Excel formulas. Find each of the values indicated below, using Excel formulas. Include these items on your Excel worksheet, below your summary statistics output. Note: Quartile/percentile values found with Excel are computed using a slightly different method than what we would use by hand. (See Bb for demonstration videos, if needed.) i. Find the first quartile. ii. Find the third quartile. iii. Find the population standard deviation. (Note: This data set is not for a population. So even though, we are able to find this measurement, it would not be an appropriate value to describe these data.) iv. Find the 20th percentile. v. Find the 67th percentile.
Step by Step Solution
There are 3 Steps involved in it

Get step-by-step solutions from verified subject matter experts