

Question: In this lab we will again use data that we originally looked at in lab one. That data provided three types of weather data for
In this lab we will again use data that we originally looked at in lab one. That data provided three types of weather data for cites that were located on the west coast, in the mid west and on the east coast. In lab one you chose one of the three weather measurements (precipitation, Ave. Jan. temp or Ave. July temp). For lab one I asked you to find descriptive information (means and standard deviations) for each region and to describe how those regions differed. Now, we will use the statistical test of one way ANOVA and post hoc testing to identify if there are differences beyond what would be expected by chance, between geographic regions. In case you do not still have the data from lab one you can find the list of data in the Lab materials folder under the Lab One Data option. While you do not need to analyze the same weather data for lab four you are welcome to stick with the same data so that you can see how your "eye ball" evaluation of differences is the same or different from a statistical evaluation of differences.
1) Define the population from which these three samples have been selected.

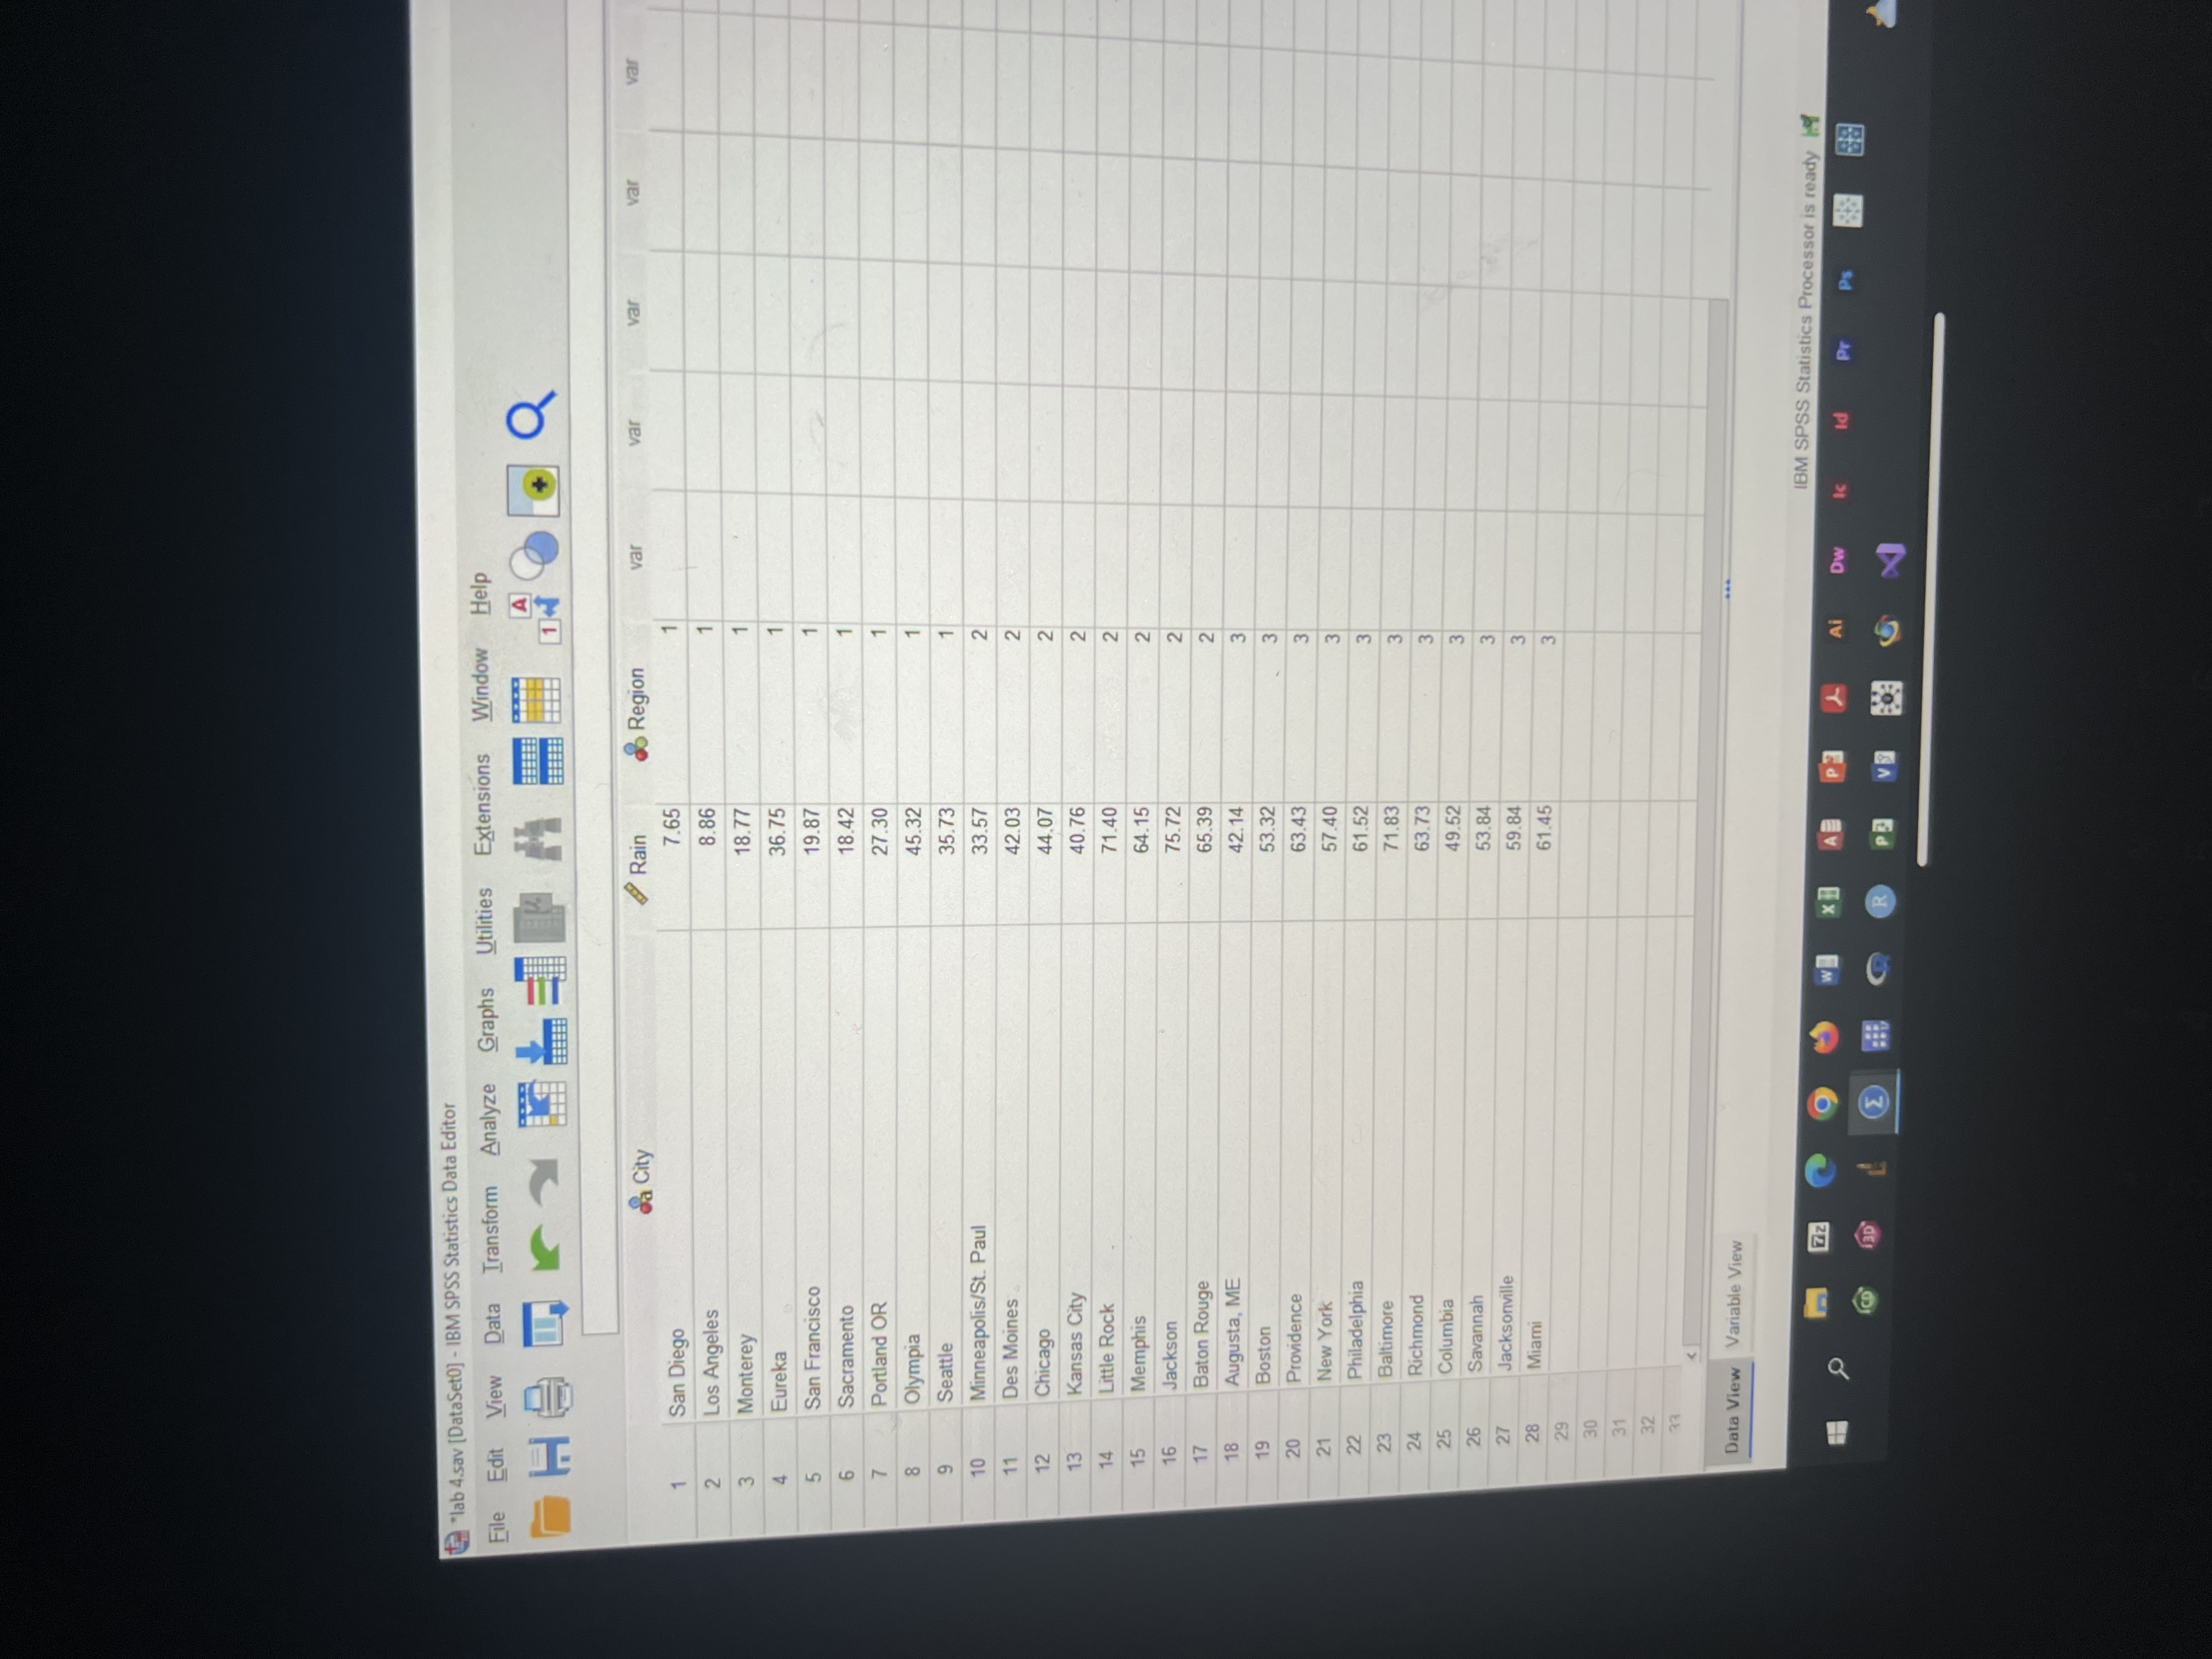
3.spv [Document3] - IBM SPSS Statistics Viewer dit View Data Transform Insert Format Analyze Graphs Utilities Extensions Window jury 6419.277 12, 3209.639 21.007 Input Region 5 33 34 Data View Variable View IBM SPSS Statistics Processor is ready haf Unicode:ON Classic Pr Ps &:51 PM 9 A P3 Ai DW id 66'F Wednesday 4x 4/12/2023 CD 3D"lab 4.sav [DataSetO] - IBM SPSS Statistics Data Editor File Edit View Data Transform Analyze Graphs Utilities Extensions Window Help A Q var var var da City Rain Region var var 7.65 1 San Diego 8.86 2 Los Angeles 3 18.77 Monterey A 36.75 Eureka 19.87 5 San Francisco 6 Sacramento 18.42 Portland OR 27.30 8 Olympia 45.32 9 Seattle 35.73 10 Minneapolis/St. Paul 33.57 11 Des Moines 42.03 12 Chicago 44.07 13 Kansas City 40.76 14 Little Rock 71.40 15 Memphis 64.15 16 Jackson 75.72 65.39 W W W W W W W W W W W N N N N N N N N- - - 17 Baton Rouge 18 Augusta, ME 42.14 19 Boston 53.32 20 Providence 63.43 21 New York 57.40 22 Philadelphia 61.52 23 Baltimore 71.83 24 Richmond 63.73 25 Columbia 49.52 26 Savannah 53.84 27 Jacksonville 59.84 28 Miami 61.45 29 30 31 32 23 Data View Variable View IBM SPSS Statistics Processor is ready Zz 9 Ai DW id Pr Ps CD P XI
Step by Step Solution
There are 3 Steps involved in it

Get step-by-step solutions from verified subject matter experts