

Question: In this part we are going to use sample data and prepare charts to address the issue raised by a CEO. After viewing only the
In this part we are going to use sample data and prepare charts to address the issue raised by a CEO. After viewing only the traditional costing data, the CEO of a company wants to promote Product C aggressively and phase out Product B entirely because he believes it is not profitable enough to justify keeping. You are charged 6 with determining if the cost data is really correct and providing evidence to support the CEO or provider other alternatives if you disagree with the CEOs plan. We would have already done the ABC analysis to determine a more accurate allocation of OH costs. Now you are going to prepare the graphs and a response to the CEO. You will be making two charts. One will compare the OH cost allocations for the three products across Traditional and ABC. The second chart will compare the Gross Margin Percentages for the three products across Traditional and ABC.
1. Start by opening or continuing your work in the Excel 3 Data file and open the Example Solution tab.
2. Go to the Insert ribbon, and select the type of chart you would like to create. Once the blank box opens, go to Select Data and enter the OH costs for products A, B and C under Traditional Costing as your first series then the OH costs for A, B and C under ABC as your second series. The horizontal axis bars should be PRODUCT A, PRODUCT B, PRODUCT C
3. Format the chart to make it visually appealing. At a minimum you will want to add a title, but I would suggest changing font sizes as well to make the graph easier to read. Copy this chart into a Word document.
4. Repeat steps 1-3 using the Gross Margin Percentage data. Notice you have negative margins on one product so your graph will look a little different this is FINE. Format the graph so it looks professional then copy this chart into a Word document.
5. Now, prepare a short response to the CEO addressing whether you think he should promote C and phase out B and why (make sure you reference your charts). You should also suggest other things the company could consider implementing to be more profitable based on the traditional vs. ABC analysis you have completed (aim for four or five suggestions).
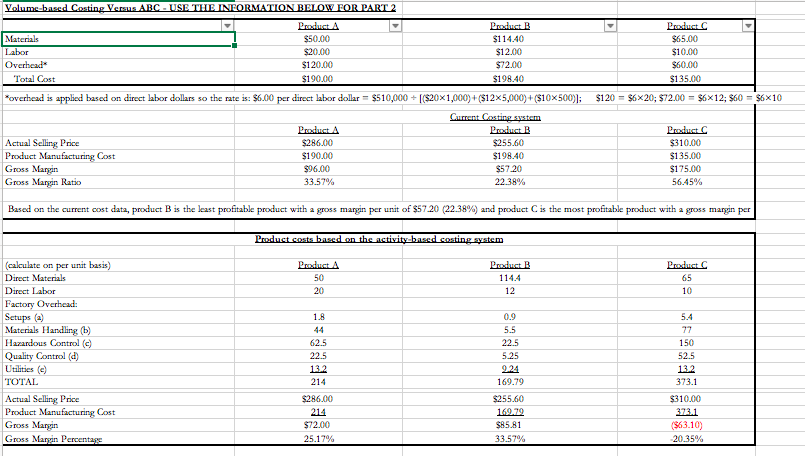
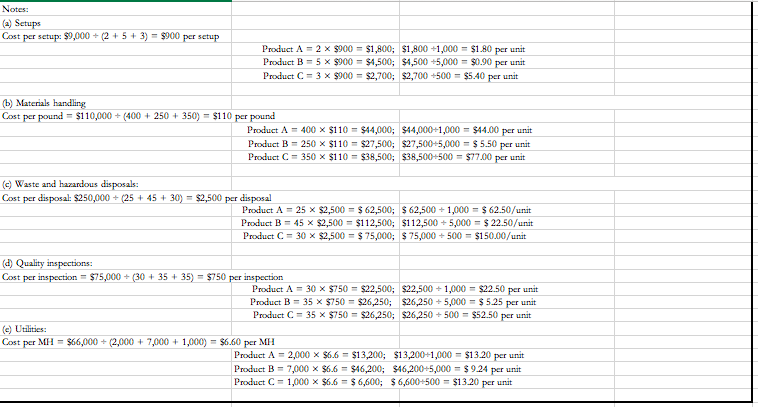
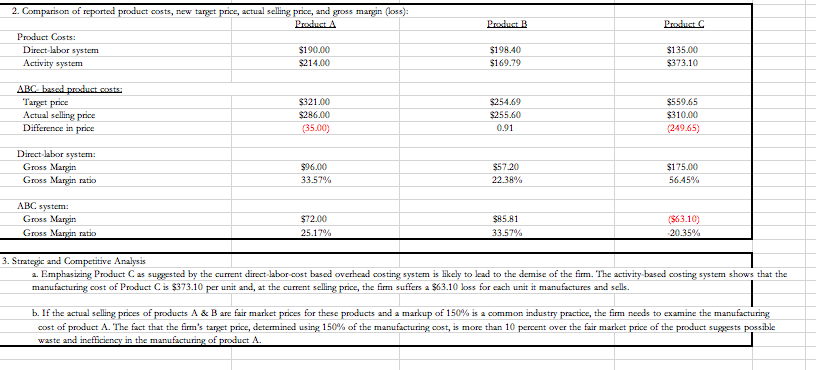
Volume-based Costing Versus ABC - USE THE INFORMATION BELOW FOR PART 2 Product A Prudent Materials $50.00 $114.40 Labor $20.00 $12.00 Overhead $120.00 $72.00 Total Cost $190,00 $198.40 *overhead is applied based on direct labor dollars so the rate is: $6.00 per direct labor dollar = $510,000+ [($20X1,000)+($125,000)+($10X500)); Current Costing system Product A Product B Actual Selling Price $286.00 $255.60 Product Manufacturing Cost $190.00 $198.40 Gross Margin $96.00 $57.20 Gross Margin Ratio 33.57% 22.38% Product C $65.00 $10.00 $60.00 $135.00 $120 = $6x20; $72.00 = $6x12; $60 = $6x10 Product C $310.00 $135.00 $175.00 56.45% Based on the current cost data, product B is the least profitable product with a gross margin per unit of $57.20 (22.38%) and product C is the most profitable product with a gross margin per Product costs based on the activity based costing system Product A 50 20 Product B 114.4 12 Predst. 65 10 1.8 (calculate on per unit basis) Direct Materials Direct Labor Factory Overhead: Setups () Materials Handling (b) Hazardous Control (c) Quality Control (d) Utilities TOTAL Actual Selling Price Product Manufacturing Cost Gross Margin Gross Maryin Percentage 62.5 22.5 13.2 214 0.9 5.5 225 5.25 924 169.79 $255.60 169.29 $85.81 33.57% 5.4 77 150 52.5 13.2 373.1 $286.00 $310.00 373.1 ($63.10) 20.35% $72.00 25.17% Notes: (a) Setups Cost per setup: $9,000 + (2 + 5+ 3) = $900 per setup Product A = 2 x $900 = $1,800; $1,800 +1,000 = $1.80 per Product B = 5 x $900 = $1,500; $4,500 +5,000 = $0.90 per unit Product C = 3 X $900 = $2,700; $2,700 +500 - $5.40 per unit (b) Materials handling Cost per pound = $110,000 + (400 + 250 + 350) = $110 per pound Product A = 400 x $110 = $14,000; $44,000+1,000 = $14.00 per unit Product B = 250 x $110 = $27,500; $27,500-5,000 = $5.50 per unit Product C = 350 x $110 - $38,500; $38,500+500 - $77.00 per unit (c) Waste and hazardous disposals: Cost per disposal: $250,000 + (25+45 + 30) = $2,500 per disposal Product A = 25 x $2,500 = $ 62,500; $ 62,500 + 1,000 = $62.50/unit Product B = 45 x $2,500 = $112,500; $112,500 +5,000 = $ 22.50/unit Product C = 30 x $2,500 = $ 75,000; $ 75,000+500 = $150.00/unit (d) Quality inspections: Cost per inspection = $75,000 + (30 + 35 + 35) = $750 per inspection Product A = 30 x $750 = $22,500; $22,500 + 1,000 = $22.50 per unit Product B = 35 x $750 = $26,250; $26,250 5,000 = $5.25 per unit Product C = 35 X $750 - $26,250; $26,250 +500 - $52.50 per unit (c) Utilities: Cost per MH = $66,000 +(2,000 + 7,000 + 1,000) = $6.60 per MH Product A = 2,000 x $6.6 = $13,200; $13,200-1,000 = $13.20 per unit Product B = 7,000 x $6.6 = $46,200; $46,200+5,000 = $924 per unit Product C = 1,000 x $6.6 = $ 6,600; $6,600+500 = $13.20 per unit Product B Product C 2. Comparison of reported product costs, new target price, actual selling price, and gross margin (loss): Product A Product Costs: Direct labor system $190.00 Activity system $214.00 $198.40 $169.79 $135.00 $373.10 ABC based product costs: Target price Actual selling price Difference in price $321.00 $286.00 (35.00) $254.69 S255.60 0.91 $559.65 $310.00 (249.65) Direct labor system: Gross Margin Gross Margin ratio $96.00 33.57% $57.20 22.38% $175.00 56.45% ABC system: Gross Margin Gross Maryin ratio $72.00 25.17% $85.81 33.57% (563.10) 20.35% 3. Strategic and Competitive Analysis 2. Emphasizing Product Cas suggested by the current direct labor cost based overhead costing system is likely to lead to the demise of the firm. The activity based costing system shows that the manufacturing cost of Product C is $373.10 per unit and, at the current selling price, the firm suffers a $63.10 loss for each unit it manufactures and sells. b. If the actual selling prices of products A & B are fair market prices for these products and a markup of 150% is a common industry practice, the firm needs to examine the manufacturing cost of product A. The fact that the firm's target price, determined using 150% of the manufacturing cost, is more than 10 percent over the fair market price of the product suggests possible waste and inefficiency in the manufacturing of product A. Volume-based Costing Versus ABC - USE THE INFORMATION BELOW FOR PART 2 Product A Prudent Materials $50.00 $114.40 Labor $20.00 $12.00 Overhead $120.00 $72.00 Total Cost $190,00 $198.40 *overhead is applied based on direct labor dollars so the rate is: $6.00 per direct labor dollar = $510,000+ [($20X1,000)+($125,000)+($10X500)); Current Costing system Product A Product B Actual Selling Price $286.00 $255.60 Product Manufacturing Cost $190.00 $198.40 Gross Margin $96.00 $57.20 Gross Margin Ratio 33.57% 22.38% Product C $65.00 $10.00 $60.00 $135.00 $120 = $6x20; $72.00 = $6x12; $60 = $6x10 Product C $310.00 $135.00 $175.00 56.45% Based on the current cost data, product B is the least profitable product with a gross margin per unit of $57.20 (22.38%) and product C is the most profitable product with a gross margin per Product costs based on the activity based costing system Product A 50 20 Product B 114.4 12 Predst. 65 10 1.8 (calculate on per unit basis) Direct Materials Direct Labor Factory Overhead: Setups () Materials Handling (b) Hazardous Control (c) Quality Control (d) Utilities TOTAL Actual Selling Price Product Manufacturing Cost Gross Margin Gross Maryin Percentage 62.5 22.5 13.2 214 0.9 5.5 225 5.25 924 169.79 $255.60 169.29 $85.81 33.57% 5.4 77 150 52.5 13.2 373.1 $286.00 $310.00 373.1 ($63.10) 20.35% $72.00 25.17% Notes: (a) Setups Cost per setup: $9,000 + (2 + 5+ 3) = $900 per setup Product A = 2 x $900 = $1,800; $1,800 +1,000 = $1.80 per Product B = 5 x $900 = $1,500; $4,500 +5,000 = $0.90 per unit Product C = 3 X $900 = $2,700; $2,700 +500 - $5.40 per unit (b) Materials handling Cost per pound = $110,000 + (400 + 250 + 350) = $110 per pound Product A = 400 x $110 = $14,000; $44,000+1,000 = $14.00 per unit Product B = 250 x $110 = $27,500; $27,500-5,000 = $5.50 per unit Product C = 350 x $110 - $38,500; $38,500+500 - $77.00 per unit (c) Waste and hazardous disposals: Cost per disposal: $250,000 + (25+45 + 30) = $2,500 per disposal Product A = 25 x $2,500 = $ 62,500; $ 62,500 + 1,000 = $62.50/unit Product B = 45 x $2,500 = $112,500; $112,500 +5,000 = $ 22.50/unit Product C = 30 x $2,500 = $ 75,000; $ 75,000+500 = $150.00/unit (d) Quality inspections: Cost per inspection = $75,000 + (30 + 35 + 35) = $750 per inspection Product A = 30 x $750 = $22,500; $22,500 + 1,000 = $22.50 per unit Product B = 35 x $750 = $26,250; $26,250 5,000 = $5.25 per unit Product C = 35 X $750 - $26,250; $26,250 +500 - $52.50 per unit (c) Utilities: Cost per MH = $66,000 +(2,000 + 7,000 + 1,000) = $6.60 per MH Product A = 2,000 x $6.6 = $13,200; $13,200-1,000 = $13.20 per unit Product B = 7,000 x $6.6 = $46,200; $46,200+5,000 = $924 per unit Product C = 1,000 x $6.6 = $ 6,600; $6,600+500 = $13.20 per unit Product B Product C 2. Comparison of reported product costs, new target price, actual selling price, and gross margin (loss): Product A Product Costs: Direct labor system $190.00 Activity system $214.00 $198.40 $169.79 $135.00 $373.10 ABC based product costs: Target price Actual selling price Difference in price $321.00 $286.00 (35.00) $254.69 S255.60 0.91 $559.65 $310.00 (249.65) Direct labor system: Gross Margin Gross Margin ratio $96.00 33.57% $57.20 22.38% $175.00 56.45% ABC system: Gross Margin Gross Maryin ratio $72.00 25.17% $85.81 33.57% (563.10) 20.35% 3. Strategic and Competitive Analysis 2. Emphasizing Product Cas suggested by the current direct labor cost based overhead costing system is likely to lead to the demise of the firm. The activity based costing system shows that the manufacturing cost of Product C is $373.10 per unit and, at the current selling price, the firm suffers a $63.10 loss for each unit it manufactures and sells. b. If the actual selling prices of products A & B are fair market prices for these products and a markup of 150% is a common industry practice, the firm needs to examine the manufacturing cost of product A. The fact that the firm's target price, determined using 150% of the manufacturing cost, is more than 10 percent over the fair market price of the product suggests possible waste and inefficiency in the manufacturing of product A
Step by Step Solution
There are 3 Steps involved in it
To address the CEOs decision using the traditional and ABC costing methods lets follow these steps Step 1 Create the Charts Chart 1 Overhead Cost Allo... View full answer

Get step-by-step solutions from verified subject matter experts