

Question: In this problem we will create some simulated data and fit linear regression models to it. a. Generate a predictor variable x by sampling 100
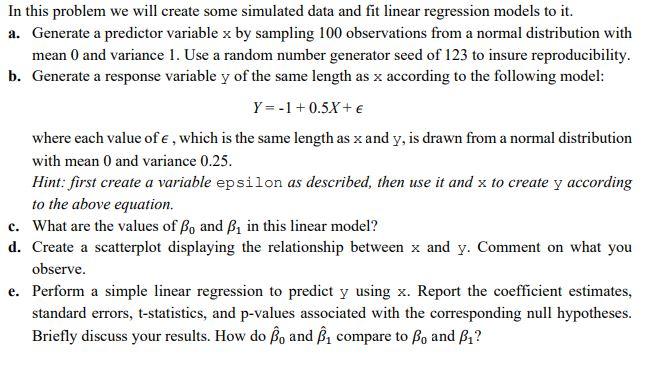
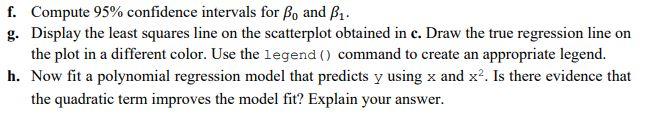
In this problem we will create some simulated data and fit linear regression models to it. a. Generate a predictor variable x by sampling 100 observations from a normal distribution with mean 0 and variance 1. Use a random number generator seed of 123 to insure reproducibility. b. Generate a response variable y of the same length as x according to the following model: Y= -1 +0.5X + where each value of , which is the same length as x and y, is drawn from a normal distribution with mean 0 and variance 0.25. Hint: first create a variable epsilon as described, then use it and x to create y according to the above equation. c. What are the values of Bo and B, in this linear model? d. Create a scatterplot displaying the relationship between x and y. Comment on what you observe. e. Perform a simple linear regression to predict y using x. Report the coefficient estimates; standard errors, t-statistics, and p-values associated with the corresponding null hypotheses. Briefly discuss your results. How do o and , compare to Bo and B? f. Compute 95% confidence intervals for Bo and B. g. Display the least squares line on the scatterplot obtained in c. Draw the true regression line on the plot in a different color. Use the legend () command to create an appropriate legend. h. Now fit a polynomial regression model that predicts y using x and x2. Is there evidence that the quadratic term improves the model fit? Explain your
Step by Step Solution
There are 3 Steps involved in it

Get step-by-step solutions from verified subject matter experts