

Question: In this problem, we will use the population dataset from lecture, institution_level_data, containing information from 2019 on all 1842 US colleges and universities that
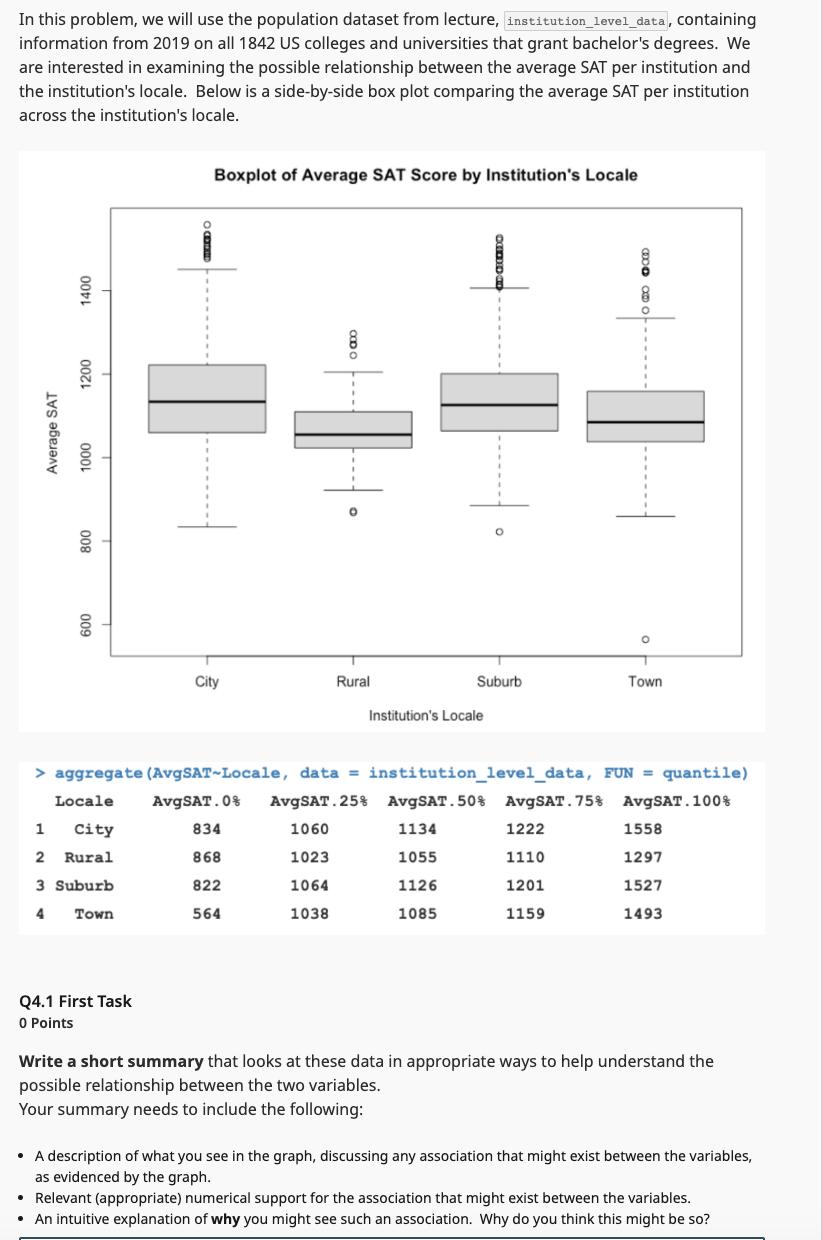
In this problem, we will use the population dataset from lecture, institution_level_data, containing information from 2019 on all 1842 US colleges and universities that grant bachelor's degrees. We are interested in examining the possible relationship between the average SAT per institution and the institution's locale. Below is a side-by-side box plot comparing the average SAT per institution across the institution's locale. Average SAT 1400 1200 1000 800 600 T Boxplot of Average SAT Score by Institution's Locale Q4.1 First Task 0 Points City Rural Suburb Institution's Locale O > aggregate (AvgSAT-Locale, data = institution_level_data, FUN = quantile) Locale AvgSAT.0% AvgSAT.25% 1 City 834 1060 2 Rural 868 1023 3 Suburb 822 1064 4 Town 564 1038 Town 1201 1159 AvgSAT.50% AvgSAT. 75% AvgSAT.100% 1134 1222 1055 1110 1126 1085 1558 1297 1527 1493 Write a short summary that looks at these data in appropriate ways to help understand the possible relationship between the two variables. Your summary needs to include the following: A description of what you see in the graph, discussing any association that might exist between the variables, as evidenced by the graph. Relevant (appropriate) numerical support for the association that might exist between the variables. An intuitive explanation of why you might see such an association. Why do you think this might be so?
Step by Step Solution
3.41 Rating (154 Votes )
There are 3 Steps involved in it
Description of the Graph In the box plot we can observe several key features 1 Center of Distributions The horizontal lines within each box represent the median 50th percentile average SAT score for e... View full answer

Get step-by-step solutions from verified subject matter experts