

Question: IN THIS PROJECT ONLY PART II NEEDS TO BE COMPLETED PART I IS DONE PART 1 STATIS TIC IN MEDIA PROJECT An insurance company determines
IN THIS PROJECT ONLY PART II NEEDS TO BE COMPLETED PART I IS DONE
PART 1 STATIS TIC IN MEDIA PROJECT
An insurance company determines vehicle insurance premiums based on known risk factors. If a person is considered a higher risk, their premiums will be higher. One potential factor is the color of your car. The insurance company believes that people with some color cars are more likely to get in accidents. To research this, they examine police reports for recent total-loss collisions. The bar graph for the following is as shown below
the most common category is green colored car meeting collisions and the least common frequency is the grey colored car. Relative frequency 24.07 percent.
If there were 5000 individual cars included, then the total of green cars would be 1204
Blue would be 579
Red would be 949
White would be 833
Black would be 902
And grey would be 532
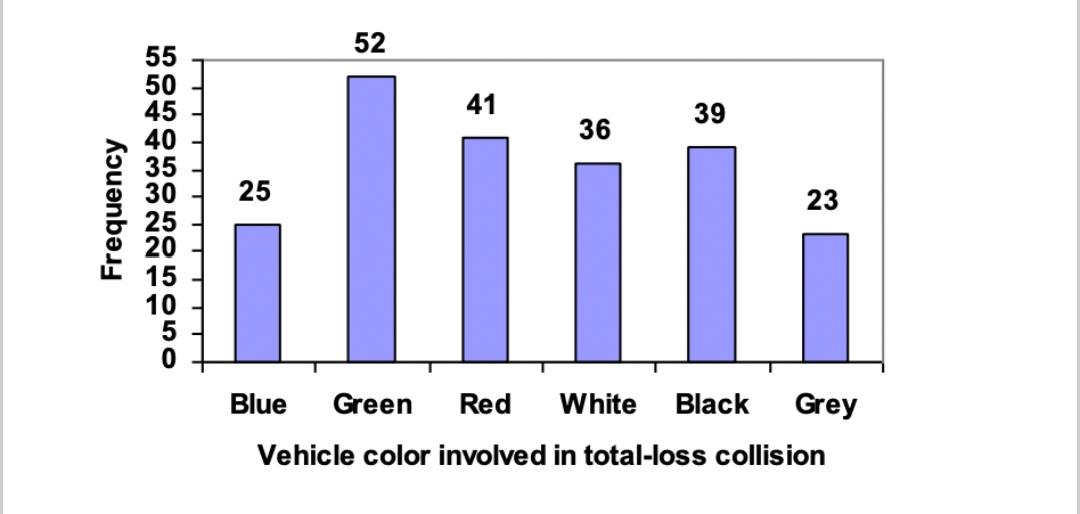
52 55 50 45 41 39 40 35 30 25 Frequency 25 20 15 ouIC Blue Green Red White Black Grey Vehicle color involved in total-loss collision
Step by Step Solution
There are 3 Steps involved in it

Get step-by-step solutions from verified subject matter experts